La Plata County, Colorado Nativity & Citizenship Status (2024)
Place of birth and citizenship status analysis for La Plata County, Colorado
La Plata County, Colorado Nativity & Citizenship Indicators (2024)
Native Born
96.9%
Foreign Born
3.1%
Naturalized
1.7%
US Citizens
98.5%
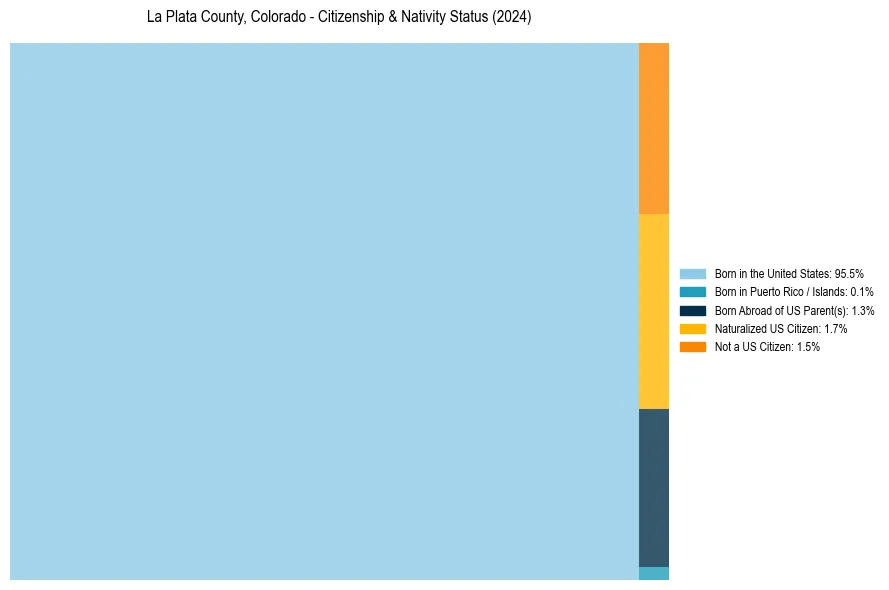
La Plata County, Colorado Nativity & Citizenship Distribution
La Plata County, Colorado Historical Nativity Trends (2010–2024)
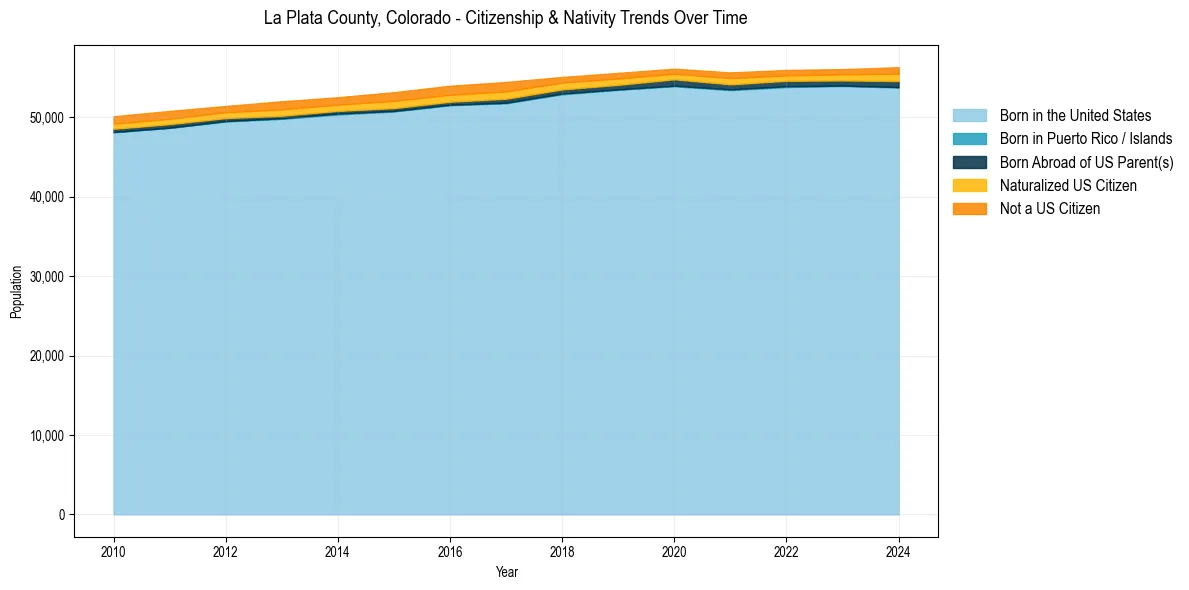
La Plata County, Colorado Population & Nativity History
| Year | Total Pop | Foreign Born | Native Born |
|---|---|---|---|
| 2024 | 56,331 | 3.1% | 96.9% |
| 2023 | 56,088 | 2.5% | 97.5% |
| 2022 | 55,983 | 2.4% | 97.6% |
| 2021 | 55,673 | 2.7% | 97.3% |
| 2020 | 56,138 | 2.4% | 97.6% |
| 2019 | 55,617 | 2.7% | 97.3% |
| 2018 | 55,101 | 2.8% | 97.2% |
| 2017 | 54,469 | 3.9% | 96.1% |
| 2016 | 53,994 | 3.7% | 96.3% |
| 2015 | 53,182 | 3.8% | 96.2% |
| 2014 | 52,547 | 3.3% | 96.7% |
| 2013 | 52,039 | 3.5% | 96.5% |
| 2012 | 51,443 | 3.0% | 97.0% |
| 2011 | 50,820 | 3.3% | 96.7% |
| 2010 | 50,149 | 3.2% | 96.8% |
Nativity & Citizenship FAQs for La Plata County, Colorado
Approximately 3.1% of residents in La Plata County, Colorado were born outside the United States.
The vast majority of residents, roughly 98.5%, are U.S. citizens (including both native-born and naturalized citizens).