Jefferson County, Colorado Nativity & Citizenship Status (2024)
Place of birth and citizenship status analysis for Jefferson County, Colorado
Jefferson County, Colorado Nativity & Citizenship Indicators (2024)
Native Born
93.7%
Foreign Born
6.3%
Naturalized
3.6%
US Citizens
97.3%
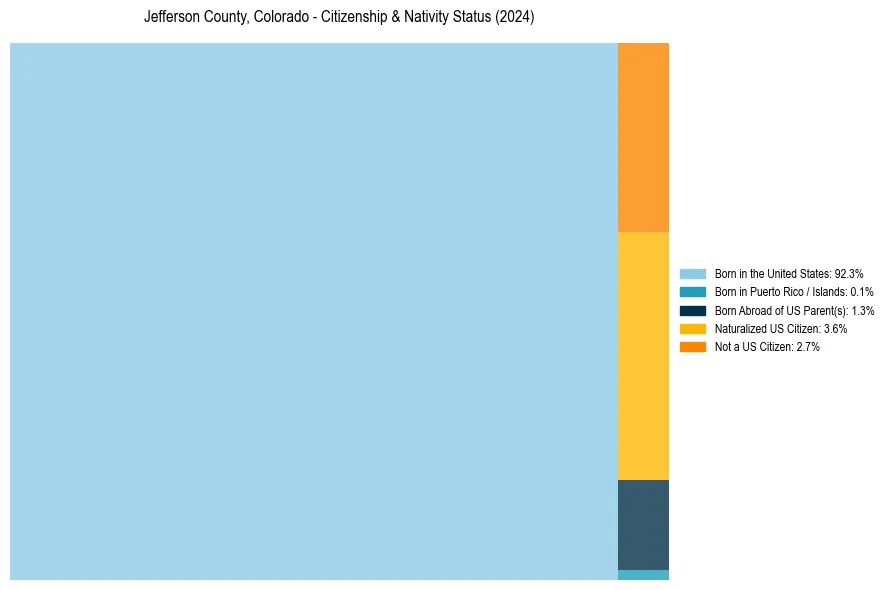
Jefferson County, Colorado Nativity & Citizenship Distribution
Jefferson County, Colorado Historical Nativity Trends (2010–2024)
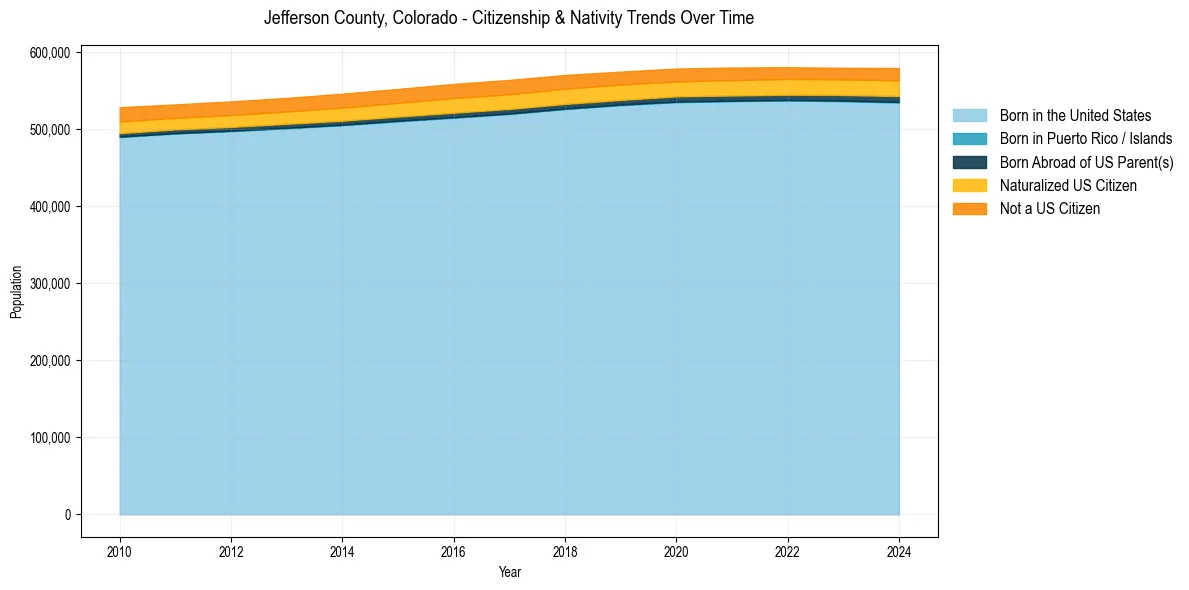
Jefferson County, Colorado Population & Nativity History
| Year | Total Pop | Foreign Born | Native Born |
|---|---|---|---|
| 2024 | 579,377 | 6.3% | 93.7% |
| 2023 | 579,715 | 6.1% | 93.9% |
| 2022 | 580,519 | 6.2% | 93.8% |
| 2021 | 580,130 | 6.3% | 93.7% |
| 2020 | 578,795 | 6.2% | 93.8% |
| 2019 | 574,798 | 6.4% | 93.6% |
| 2018 | 570,427 | 6.6% | 93.4% |
| 2017 | 564,029 | 6.7% | 93.3% |
| 2016 | 558,810 | 6.7% | 93.3% |
| 2015 | 552,344 | 6.5% | 93.5% |
| 2014 | 546,162 | 6.4% | 93.6% |
| 2013 | 540,669 | 6.2% | 93.8% |
| 2012 | 536,095 | 6.2% | 93.8% |
| 2011 | 532,243 | 6.1% | 93.9% |
| 2010 | 528,614 | 6.4% | 93.6% |
Nativity & Citizenship FAQs for Jefferson County, Colorado
Approximately 6.3% of residents in Jefferson County, Colorado were born outside the United States.
The vast majority of residents, roughly 97.3%, are U.S. citizens (including both native-born and naturalized citizens).