Garfield County, Colorado Nativity & Citizenship Status (2024)
Place of birth and citizenship status analysis for Garfield County, Colorado
Garfield County, Colorado Nativity & Citizenship Indicators (2024)
Native Born
85.9%
Foreign Born
14.1%
Naturalized
5.7%
US Citizens
91.6%
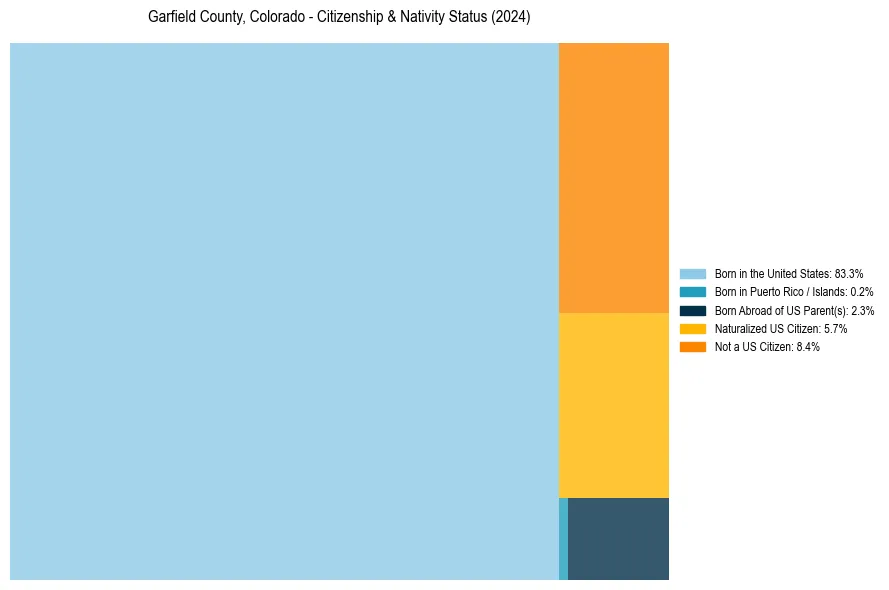
Garfield County, Colorado Nativity & Citizenship Distribution
Garfield County, Colorado Historical Nativity Trends (2010–2024)
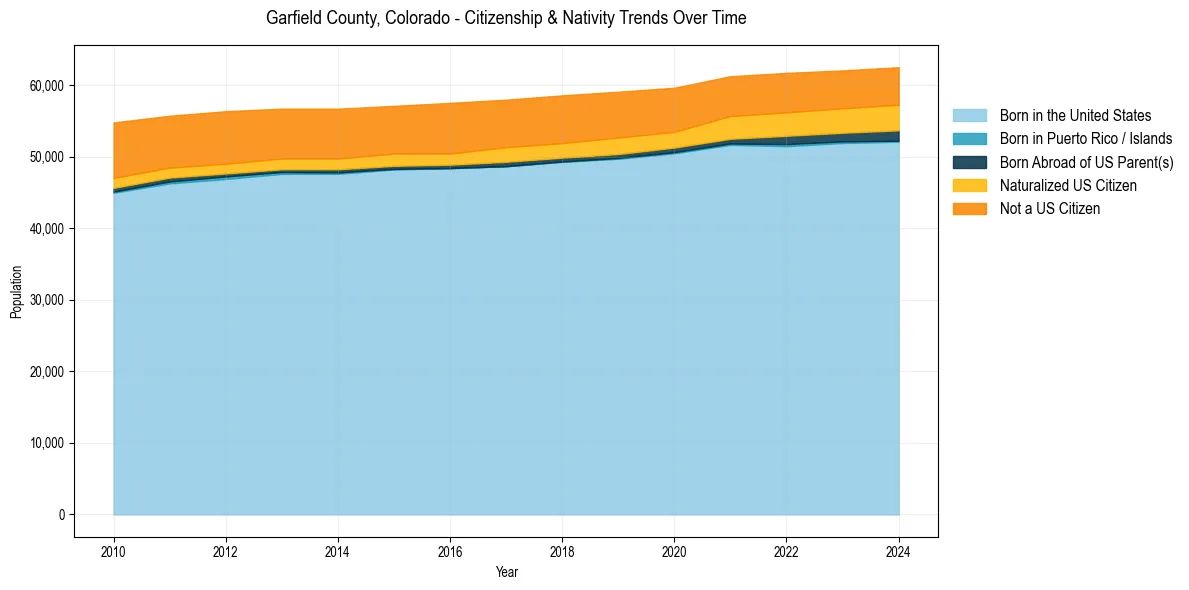
Garfield County, Colorado Population & Nativity History
| Year | Total Pop | Foreign Born | Native Born |
|---|---|---|---|
| 2024 | 62,479 | 14.1% | 85.9% |
| 2023 | 62,034 | 14.1% | 85.9% |
| 2022 | 61,683 | 14.3% | 85.7% |
| 2021 | 61,221 | 14.3% | 85.7% |
| 2020 | 59,605 | 14.0% | 86.0% |
| 2019 | 59,055 | 14.8% | 85.2% |
| 2018 | 58,538 | 14.9% | 85.1% |
| 2017 | 57,945 | 15.0% | 85.0% |
| 2016 | 57,495 | 15.0% | 85.0% |
| 2015 | 57,076 | 14.7% | 85.3% |
| 2014 | 56,684 | 14.9% | 85.1% |
| 2013 | 56,687 | 15.0% | 85.0% |
| 2012 | 56,330 | 15.4% | 84.6% |
| 2011 | 55,696 | 15.5% | 84.5% |
| 2010 | 54,761 | 16.7% | 83.3% |
Nativity & Citizenship FAQs for Garfield County, Colorado
Approximately 14.1% of residents in Garfield County, Colorado were born outside the United States.
The vast majority of residents, roughly 91.6%, are U.S. citizens (including both native-born and naturalized citizens).