Costilla County, Colorado Nativity & Citizenship Status (2024)
Place of birth and citizenship status analysis for Costilla County, Colorado
Costilla County, Colorado Nativity & Citizenship Indicators (2024)
Native Born
94.3%
Foreign Born
5.7%
Naturalized
2.4%
US Citizens
96.7%
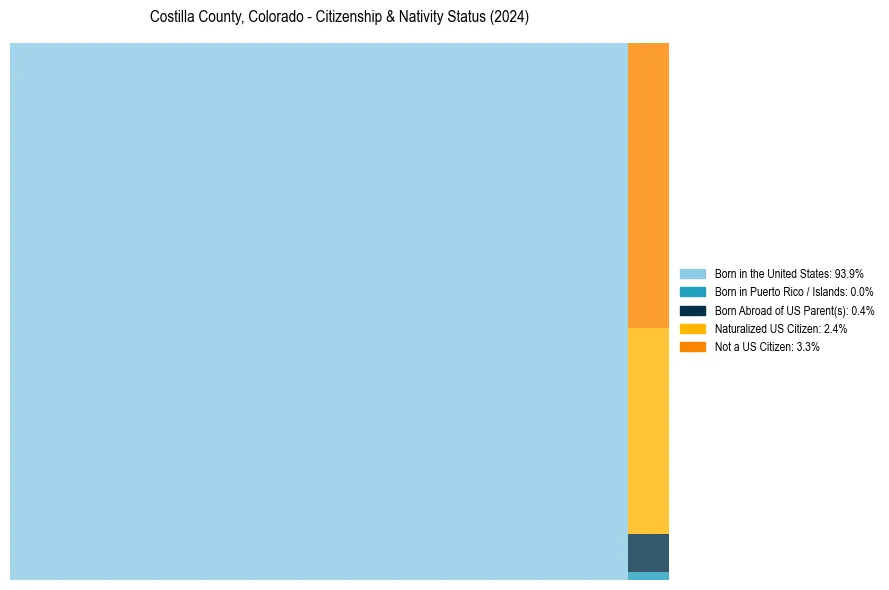
Costilla County, Colorado Nativity & Citizenship Distribution
Costilla County, Colorado Historical Nativity Trends (2010–2024)
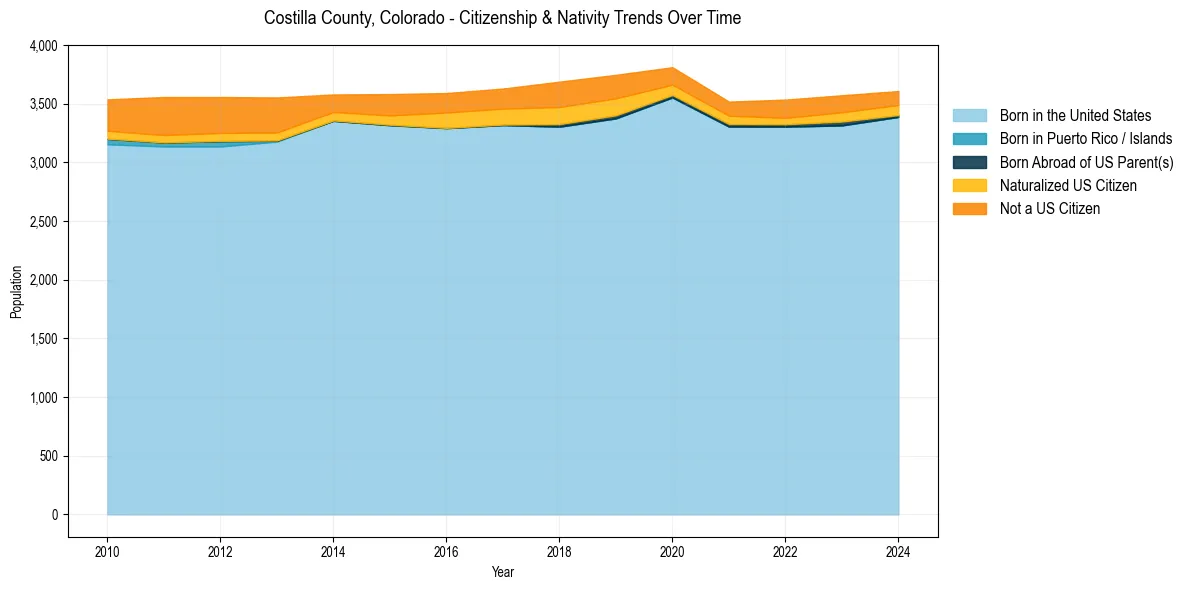
Costilla County, Colorado Population & Nativity History
| Year | Total Pop | Foreign Born | Native Born |
|---|---|---|---|
| 2024 | 3,607 | 5.7% | 94.3% |
| 2023 | 3,571 | 6.3% | 93.7% |
| 2022 | 3,534 | 5.9% | 94.1% |
| 2021 | 3,517 | 5.4% | 94.6% |
| 2020 | 3,810 | 6.2% | 93.8% |
| 2019 | 3,745 | 9.2% | 90.8% |
| 2018 | 3,687 | 9.8% | 90.2% |
| 2017 | 3,628 | 8.5% | 91.5% |
| 2016 | 3,590 | 8.3% | 91.7% |
| 2015 | 3,581 | 7.3% | 92.7% |
| 2014 | 3,578 | 6.2% | 93.8% |
| 2013 | 3,552 | 10.3% | 89.7% |
| 2012 | 3,556 | 10.5% | 89.5% |
| 2011 | 3,556 | 10.9% | 89.1% |
| 2010 | 3,536 | 9.5% | 90.5% |
Nativity & Citizenship FAQs for Costilla County, Colorado
Approximately 5.7% of residents in Costilla County, Colorado were born outside the United States.
The vast majority of residents, roughly 96.7%, are U.S. citizens (including both native-born and naturalized citizens).