Broomfield County, Colorado Nativity & Citizenship Status (2024)
Place of birth and citizenship status analysis for Broomfield County, Colorado
Broomfield County, Colorado Nativity & Citizenship Indicators (2024)
Native Born
89.5%
Foreign Born
10.5%
Naturalized
5.7%
US Citizens
95.2%
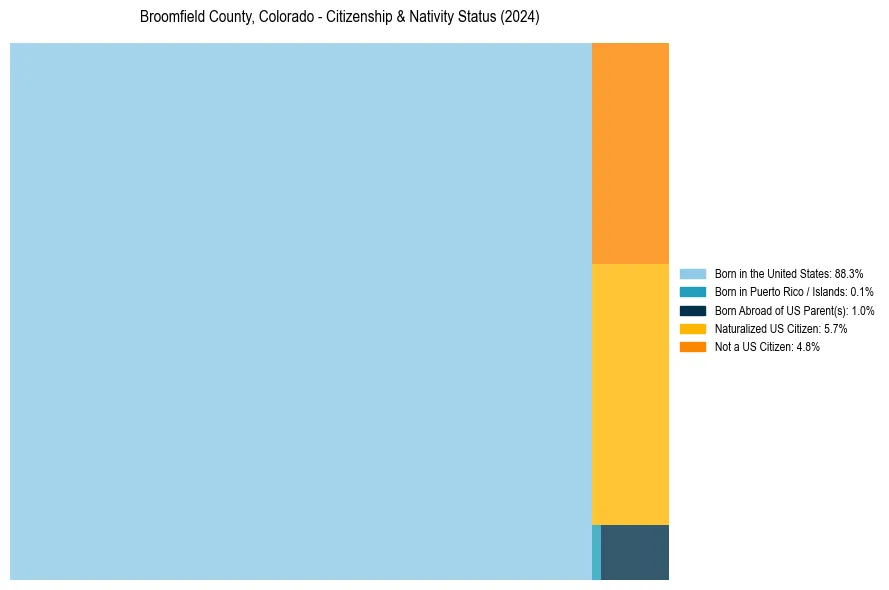
Broomfield County, Colorado Nativity & Citizenship Distribution
Broomfield County, Colorado Historical Nativity Trends (2010–2024)
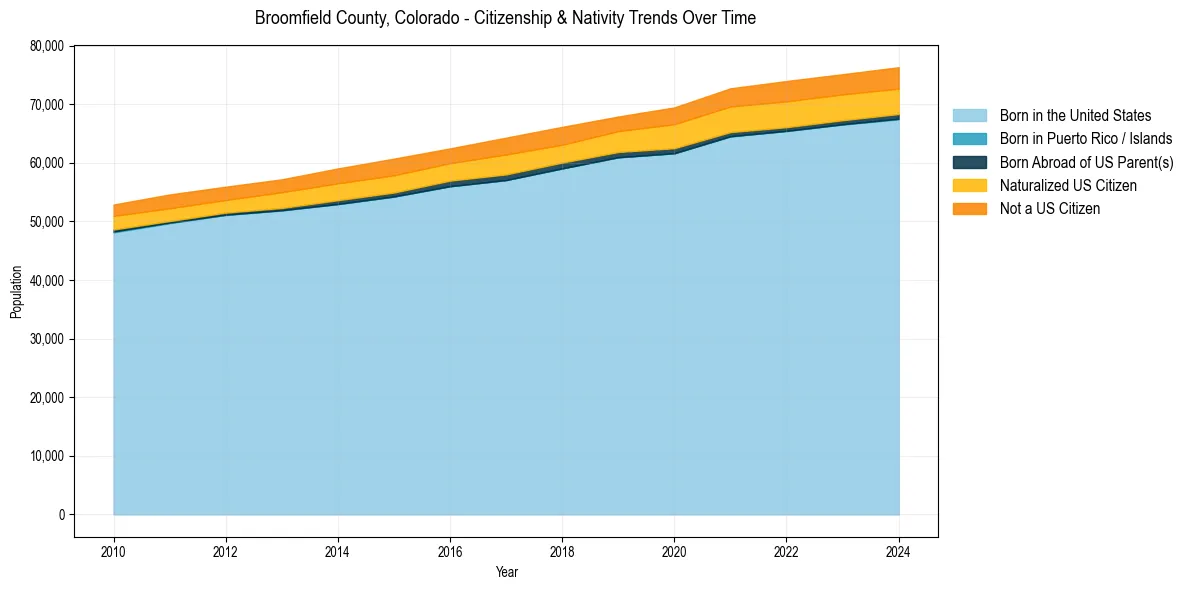
Broomfield County, Colorado Population & Nativity History
| Year | Total Pop | Foreign Born | Native Born |
|---|---|---|---|
| 2024 | 76,304 | 10.5% | 89.5% |
| 2023 | 75,110 | 10.5% | 89.5% |
| 2022 | 73,946 | 10.7% | 89.3% |
| 2021 | 72,697 | 10.3% | 89.7% |
| 2020 | 69,444 | 10.0% | 90.0% |
| 2019 | 67,886 | 8.9% | 91.1% |
| 2018 | 66,120 | 9.2% | 90.8% |
| 2017 | 64,283 | 9.8% | 90.2% |
| 2016 | 62,449 | 8.8% | 91.2% |
| 2015 | 60,699 | 9.5% | 90.5% |
| 2014 | 59,027 | 9.2% | 90.8% |
| 2013 | 57,171 | 8.6% | 91.4% |
| 2012 | 55,913 | 7.9% | 92.1% |
| 2011 | 54,592 | 8.3% | 91.7% |
| 2010 | 52,872 | 8.0% | 92.0% |
Nativity & Citizenship FAQs for Broomfield County, Colorado
Approximately 10.5% of residents in Broomfield County, Colorado were born outside the United States.
The vast majority of residents, roughly 95.2%, are U.S. citizens (including both native-born and naturalized citizens).