Boulder County, Colorado Nativity & Citizenship Status (2024)
Place of birth and citizenship status analysis for Boulder County, Colorado
Boulder County, Colorado Nativity & Citizenship Indicators (2024)
Native Born
89.9%
Foreign Born
10.1%
Naturalized
5.3%
US Citizens
95.2%
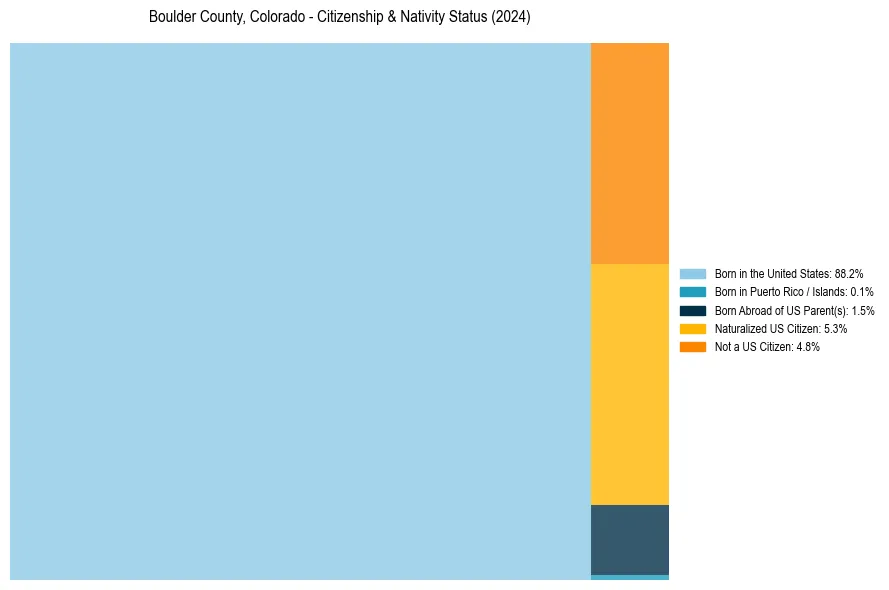
Boulder County, Colorado Nativity & Citizenship Distribution
Boulder County, Colorado Historical Nativity Trends (2010–2024)
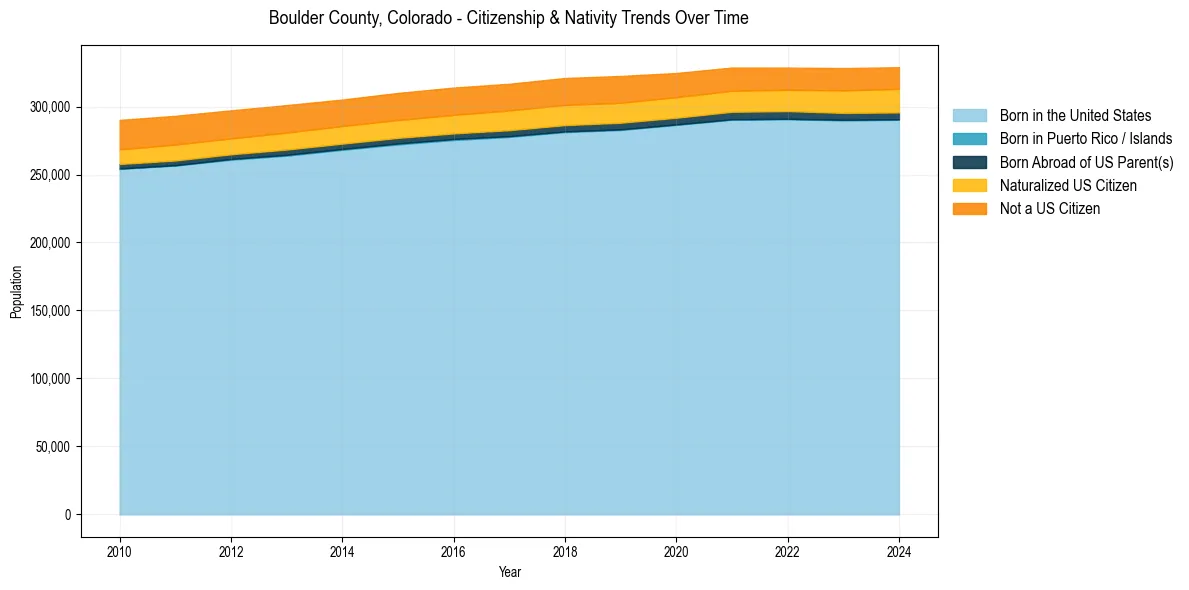
Boulder County, Colorado Population & Nativity History
| Year | Total Pop | Foreign Born | Native Born |
|---|---|---|---|
| 2024 | 328,961 | 10.1% | 89.9% |
| 2023 | 328,317 | 10.0% | 90.0% |
| 2022 | 328,658 | 9.7% | 90.3% |
| 2021 | 328,713 | 9.9% | 90.1% |
| 2020 | 324,682 | 10.1% | 89.9% |
| 2019 | 322,510 | 10.7% | 89.3% |
| 2018 | 321,030 | 10.8% | 89.2% |
| 2017 | 316,782 | 10.8% | 89.2% |
| 2016 | 313,961 | 10.7% | 89.3% |
| 2015 | 310,032 | 10.7% | 89.3% |
| 2014 | 305,166 | 10.6% | 89.4% |
| 2013 | 301,072 | 10.9% | 89.1% |
| 2012 | 297,218 | 10.9% | 89.1% |
| 2011 | 293,205 | 11.2% | 88.8% |
| 2010 | 290,177 | 11.2% | 88.8% |
Nativity & Citizenship FAQs for Boulder County, Colorado
Approximately 10.1% of residents in Boulder County, Colorado were born outside the United States.
The vast majority of residents, roughly 95.2%, are U.S. citizens (including both native-born and naturalized citizens).