Arapahoe County, Colorado Nativity & Citizenship Status (2024)
Place of birth and citizenship status analysis for Arapahoe County, Colorado
Arapahoe County, Colorado Nativity & Citizenship Indicators (2024)
Native Born
83.5%
Foreign Born
16.5%
Naturalized
8.2%
US Citizens
91.6%
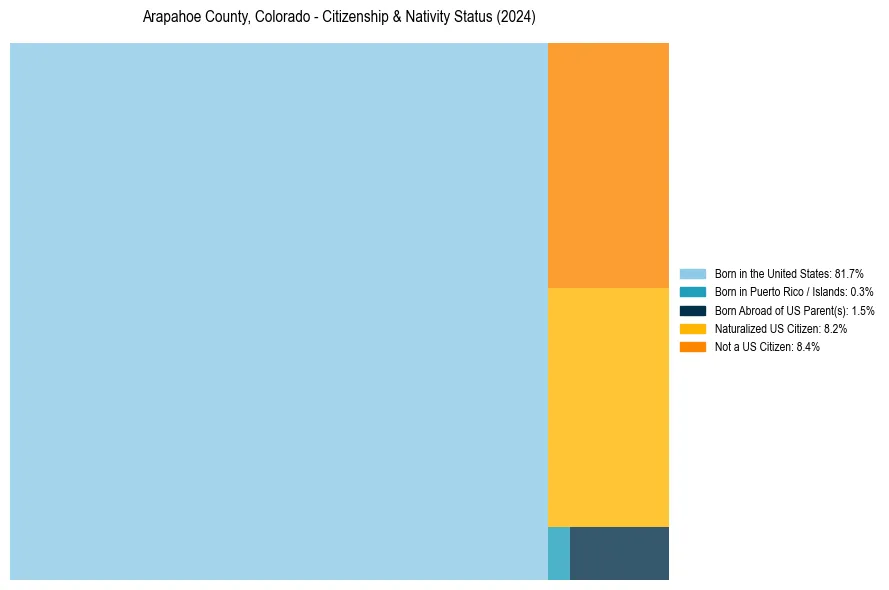
Arapahoe County, Colorado Nativity & Citizenship Distribution
Arapahoe County, Colorado Historical Nativity Trends (2010–2024)
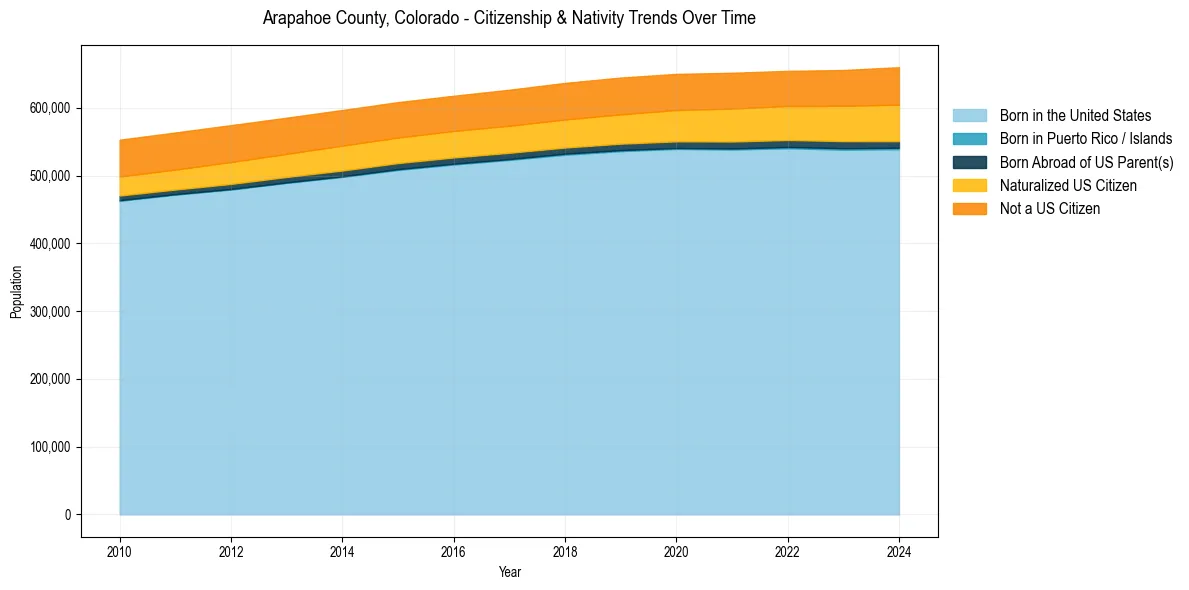
Arapahoe County, Colorado Population & Nativity History
| Year | Total Pop | Foreign Born | Native Born |
|---|---|---|---|
| 2024 | 659,844 | 16.5% | 83.5% |
| 2023 | 655,709 | 16.0% | 84.0% |
| 2022 | 654,453 | 15.6% | 84.4% |
| 2021 | 651,621 | 15.6% | 84.4% |
| 2020 | 649,980 | 15.3% | 84.7% |
| 2019 | 644,560 | 15.1% | 84.9% |
| 2018 | 636,671 | 15.0% | 85.0% |
| 2017 | 626,612 | 14.9% | 85.1% |
| 2016 | 617,668 | 14.7% | 85.3% |
| 2015 | 608,310 | 14.8% | 85.2% |
| 2014 | 596,684 | 15.0% | 85.0% |
| 2013 | 585,333 | 14.9% | 85.1% |
| 2012 | 574,357 | 15.1% | 84.9% |
| 2011 | 563,508 | 14.9% | 85.1% |
| 2010 | 552,860 | 14.9% | 85.1% |
Nativity & Citizenship FAQs for Arapahoe County, Colorado
Approximately 16.5% of residents in Arapahoe County, Colorado were born outside the United States.
The vast majority of residents, roughly 91.6%, are U.S. citizens (including both native-born and naturalized citizens).