Orange County, California Nativity & Citizenship Status (2024)
Place of birth and citizenship status analysis for Orange County, California
Orange County, California Nativity & Citizenship Indicators (2024)
Native Born
69.6%
Foreign Born
30.4%
Naturalized
17.8%
US Citizens
87.4%
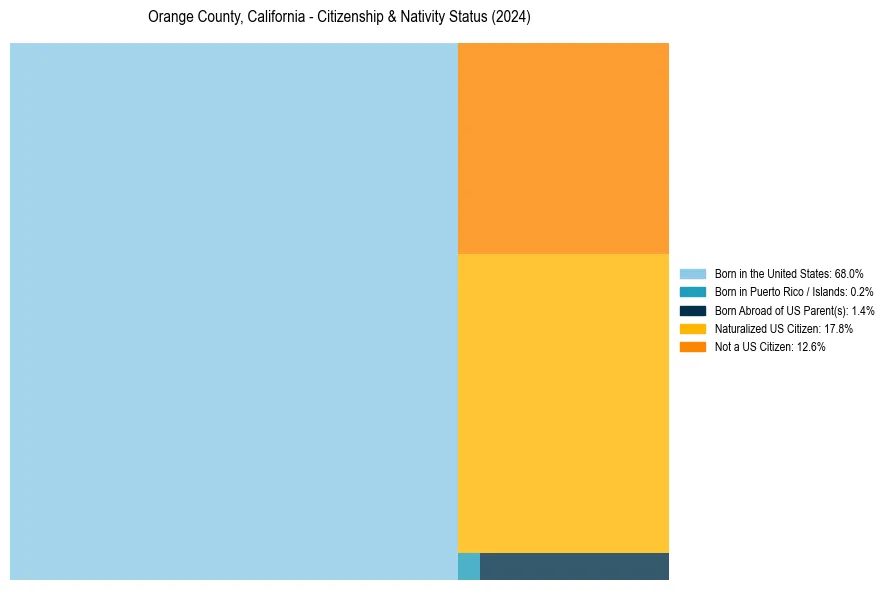
Orange County, California Nativity & Citizenship Distribution
Orange County, California Historical Nativity Trends (2010–2024)
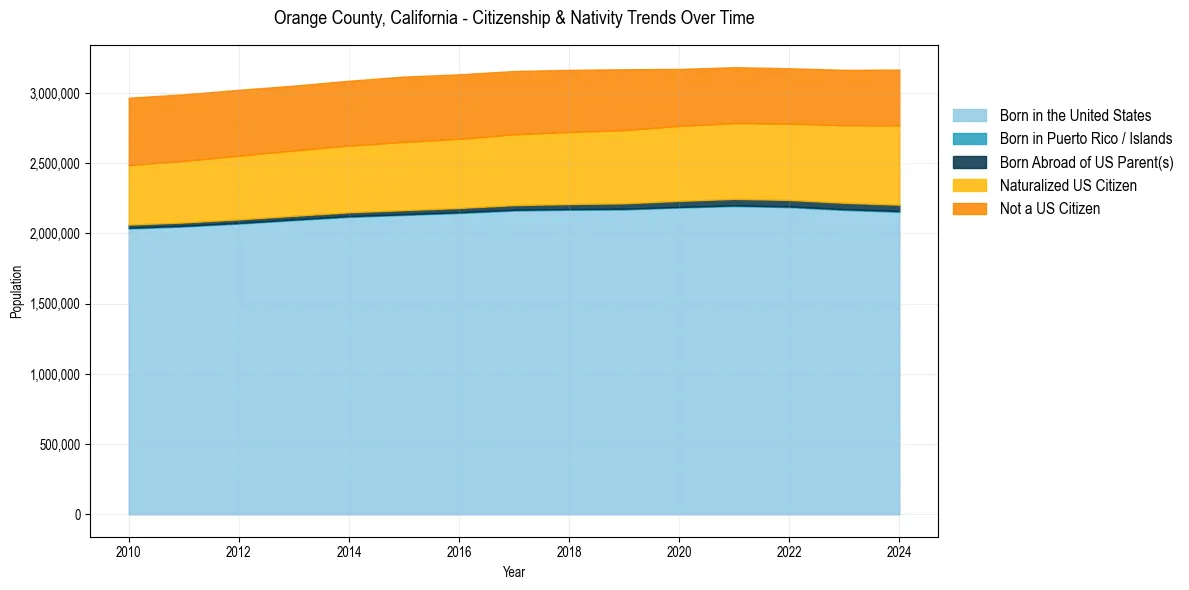
Orange County, California Population & Nativity History
| Year | Total Pop | Foreign Born | Native Born |
|---|---|---|---|
| 2024 | 3,165,820 | 30.4% | 69.6% |
| 2023 | 3,164,063 | 29.9% | 70.1% |
| 2022 | 3,175,227 | 29.5% | 70.5% |
| 2021 | 3,182,923 | 29.4% | 70.6% |
| 2020 | 3,170,345 | 29.6% | 70.4% |
| 2019 | 3,168,044 | 30.1% | 69.9% |
| 2018 | 3,164,182 | 30.2% | 69.8% |
| 2017 | 3,155,816 | 30.3% | 69.7% |
| 2016 | 3,132,211 | 30.4% | 69.6% |
| 2015 | 3,116,069 | 30.5% | 69.5% |
| 2014 | 3,086,331 | 30.3% | 69.7% |
| 2013 | 3,051,771 | 30.4% | 69.6% |
| 2012 | 3,021,840 | 30.5% | 69.5% |
| 2011 | 2,989,948 | 30.5% | 69.5% |
| 2010 | 2,965,525 | 30.5% | 69.5% |
Nativity & Citizenship FAQs for Orange County, California
Approximately 30.4% of residents in Orange County, California were born outside the United States.
The vast majority of residents, roughly 87.4%, are U.S. citizens (including both native-born and naturalized citizens).