Yuma County, Arizona Nativity & Citizenship Status (2024)
Place of birth and citizenship status analysis for Yuma County, Arizona
Yuma County, Arizona Nativity & Citizenship Indicators (2024)
Native Born
74.9%
Foreign Born
25.1%
Naturalized
11.6%
US Citizens
86.5%
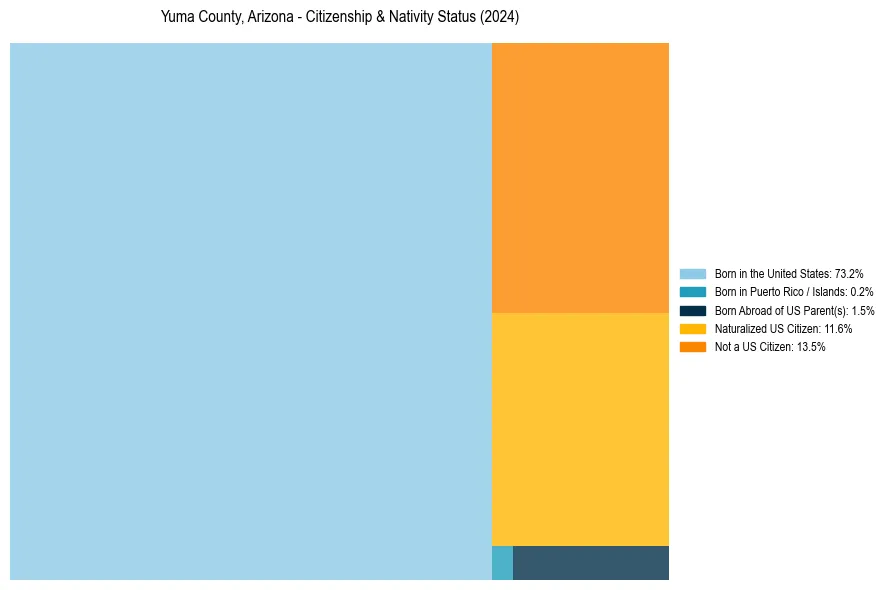
Yuma County, Arizona Nativity & Citizenship Distribution
Yuma County, Arizona Historical Nativity Trends (2010–2024)
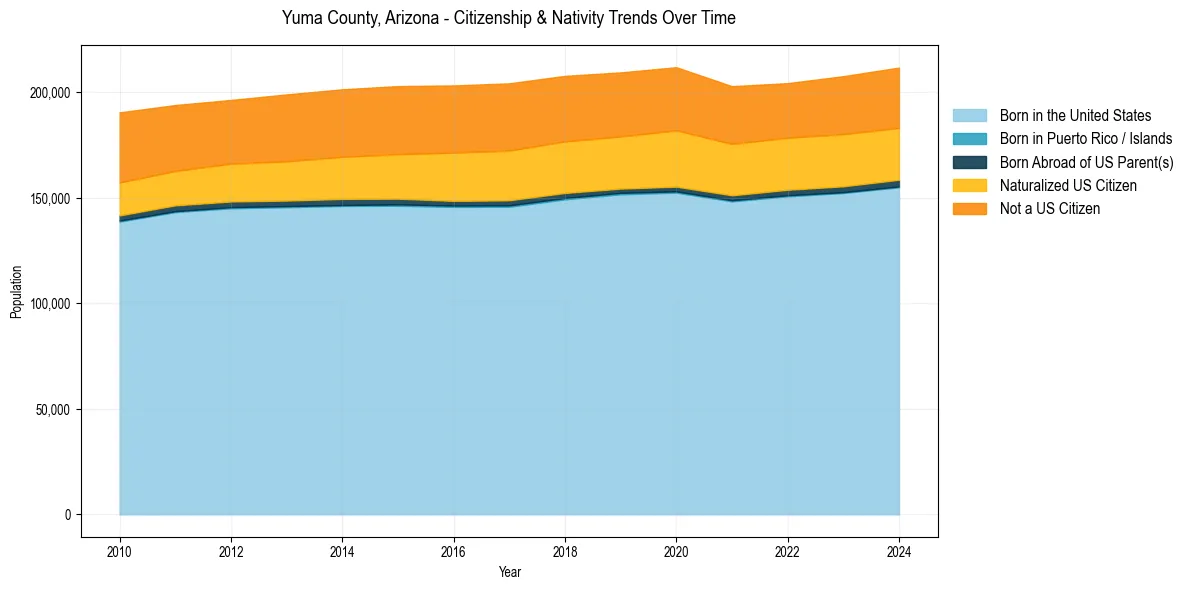
Yuma County, Arizona Population & Nativity History
| Year | Total Pop | Foreign Born | Native Born |
|---|---|---|---|
| 2024 | 211,741 | 25.1% | 74.9% |
| 2023 | 207,685 | 25.1% | 74.9% |
| 2022 | 204,374 | 24.7% | 75.3% |
| 2021 | 202,944 | 25.5% | 74.5% |
| 2020 | 211,931 | 26.7% | 73.3% |
| 2019 | 209,468 | 26.3% | 73.7% |
| 2018 | 207,829 | 26.7% | 73.3% |
| 2017 | 204,281 | 27.1% | 72.9% |
| 2016 | 203,292 | 26.9% | 73.1% |
| 2015 | 202,987 | 26.3% | 73.7% |
| 2014 | 201,453 | 25.8% | 74.2% |
| 2013 | 199,026 | 25.3% | 74.7% |
| 2012 | 196,420 | 24.5% | 75.5% |
| 2011 | 193,995 | 24.5% | 75.5% |
| 2010 | 190,526 | 25.6% | 74.4% |
Nativity & Citizenship FAQs for Yuma County, Arizona
Approximately 25.1% of residents in Yuma County, Arizona were born outside the United States.
The vast majority of residents, roughly 86.5%, are U.S. citizens (including both native-born and naturalized citizens).