Yavapai County, Arizona Nativity & Citizenship Status (2024)
Place of birth and citizenship status analysis for Yavapai County, Arizona
Yavapai County, Arizona Nativity & Citizenship Indicators (2024)
Native Born
93.6%
Foreign Born
6.4%
Naturalized
3.3%
US Citizens
96.9%
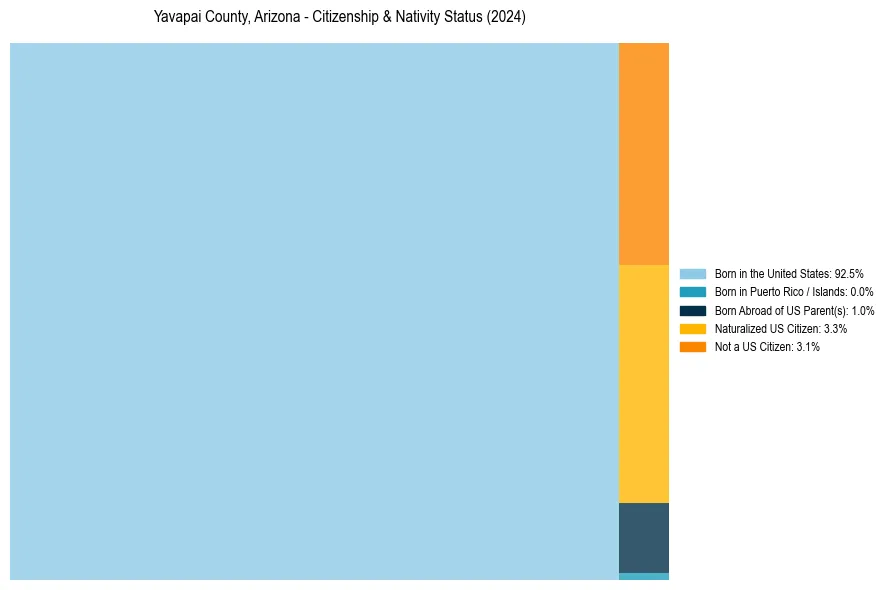
Yavapai County, Arizona Nativity & Citizenship Distribution
Yavapai County, Arizona Historical Nativity Trends (2010–2024)
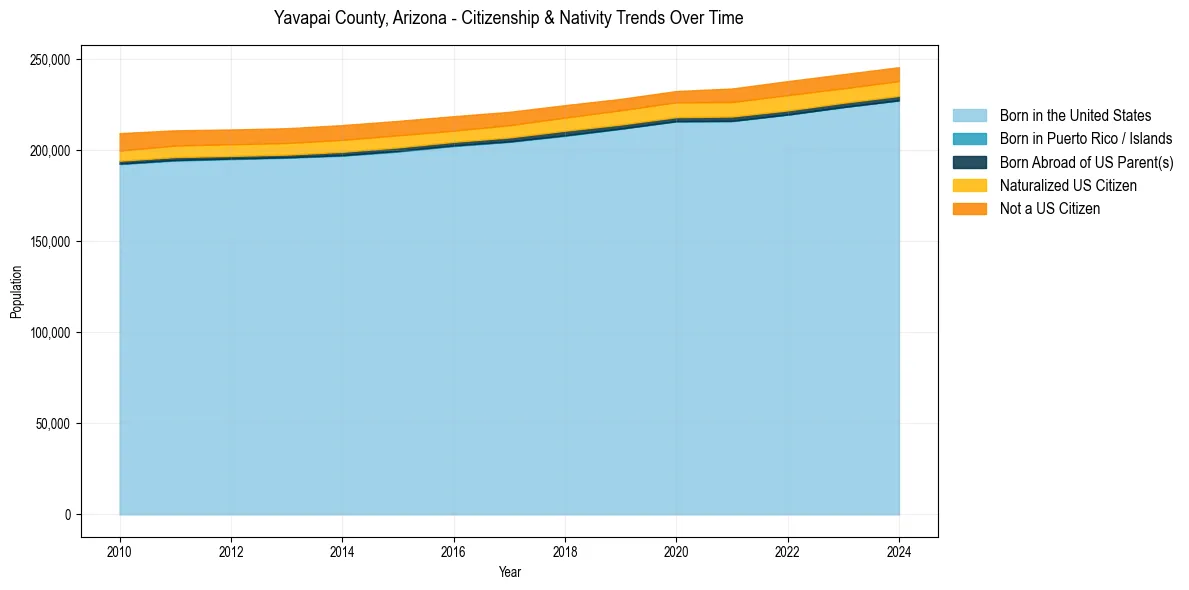
Yavapai County, Arizona Population & Nativity History
| Year | Total Pop | Foreign Born | Native Born |
|---|---|---|---|
| 2024 | 245,480 | 6.4% | 93.6% |
| 2023 | 241,656 | 6.5% | 93.5% |
| 2022 | 237,830 | 6.8% | 93.2% |
| 2021 | 233,789 | 6.6% | 93.4% |
| 2020 | 232,396 | 6.2% | 93.8% |
| 2019 | 228,067 | 6.2% | 93.8% |
| 2018 | 224,645 | 6.3% | 93.7% |
| 2017 | 220,972 | 6.4% | 93.6% |
| 2016 | 218,586 | 6.5% | 93.5% |
| 2015 | 215,996 | 6.7% | 93.3% |
| 2014 | 213,689 | 6.9% | 93.1% |
| 2013 | 211,968 | 6.8% | 93.2% |
| 2012 | 211,280 | 6.9% | 93.1% |
| 2011 | 210,838 | 7.0% | 93.0% |
| 2010 | 209,260 | 7.2% | 92.8% |
Nativity & Citizenship FAQs for Yavapai County, Arizona
Approximately 6.4% of residents in Yavapai County, Arizona were born outside the United States.
The vast majority of residents, roughly 96.9%, are U.S. citizens (including both native-born and naturalized citizens).