Santa Cruz County, Arizona Nativity & Citizenship Status (2024)
Place of birth and citizenship status analysis for Santa Cruz County, Arizona
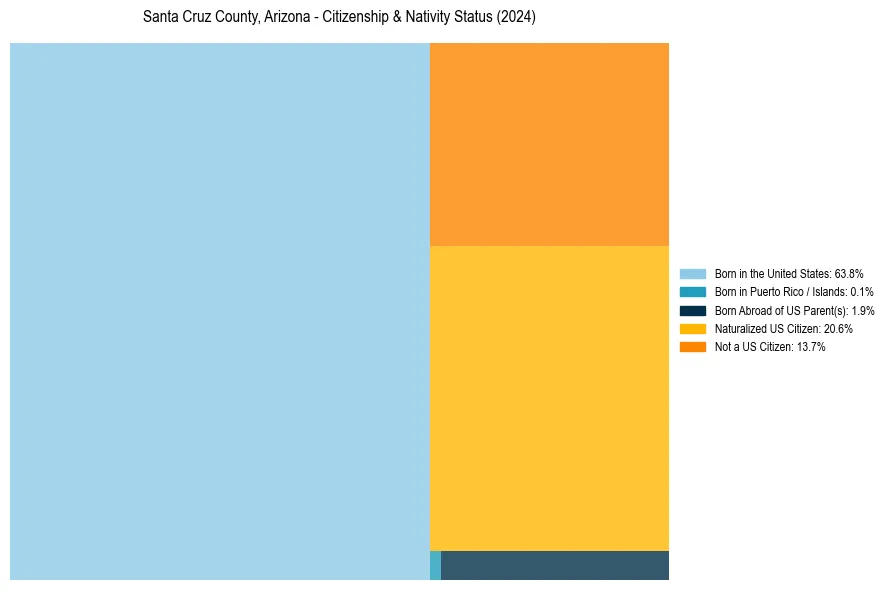
Santa Cruz County, Arizona Nativity & Citizenship Indicators (2024)
Native Born
65.8%
Foreign Born
34.2%
Naturalized
20.6%
US Citizens
86.3%
Santa Cruz County, Arizona Nativity & Citizenship Distribution
Santa Cruz County, Arizona Historical Nativity Trends (2010–2024)
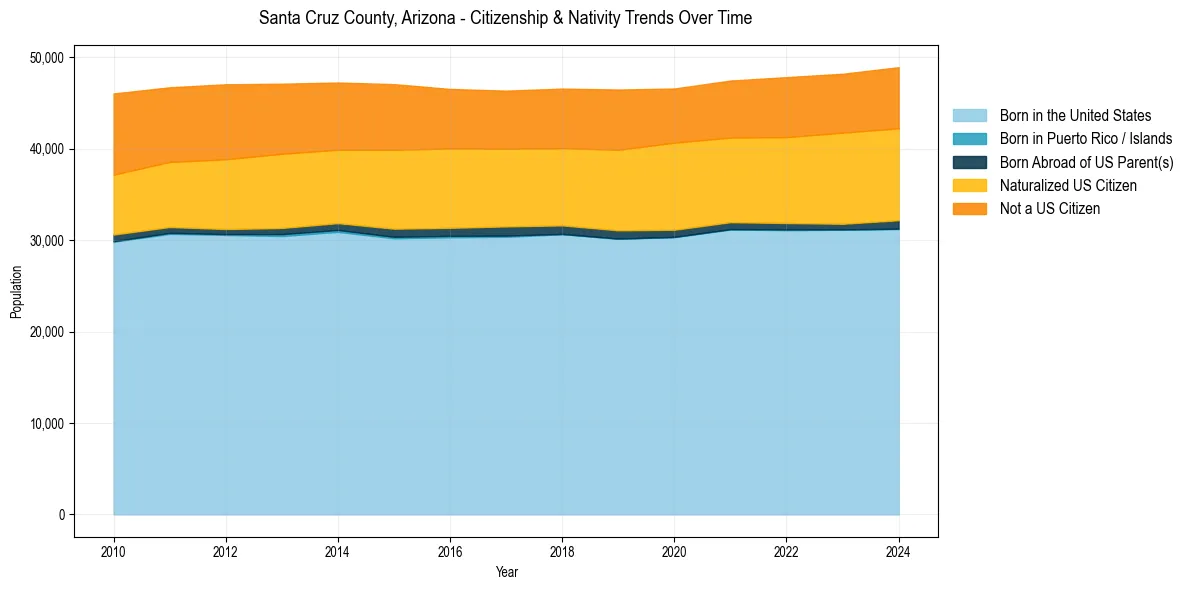
Santa Cruz County, Arizona Population & Nativity History
| Year | Total Pop | Foreign Born | Native Born |
|---|---|---|---|
| 2024 | 48,926 | 34.2% | 65.8% |
| 2023 | 48,209 | 34.1% | 65.9% |
| 2022 | 47,838 | 33.4% | 66.6% |
| 2021 | 47,463 | 32.6% | 67.4% |
| 2020 | 46,594 | 33.2% | 66.8% |
| 2019 | 46,480 | 33.1% | 66.9% |
| 2018 | 46,584 | 32.1% | 67.9% |
| 2017 | 46,358 | 32.0% | 68.0% |
| 2016 | 46,547 | 32.6% | 67.4% |
| 2015 | 47,073 | 33.6% | 66.4% |
| 2014 | 47,250 | 32.6% | 67.4% |
| 2013 | 47,122 | 33.5% | 66.5% |
| 2012 | 47,057 | 33.7% | 66.3% |
| 2011 | 46,727 | 32.7% | 67.3% |
| 2010 | 46,051 | 33.5% | 66.5% |
Nativity & Citizenship FAQs for Santa Cruz County, Arizona
Approximately 34.2% of residents in Santa Cruz County, Arizona were born outside the United States.
The vast majority of residents, roughly 86.3%, are U.S. citizens (including both native-born and naturalized citizens).