Pinal County, Arizona Nativity & Citizenship Status (2024)
Place of birth and citizenship status analysis for Pinal County, Arizona
Pinal County, Arizona Nativity & Citizenship Indicators (2024)
Native Born
90.9%
Foreign Born
9.1%
Naturalized
4.4%
US Citizens
95.3%
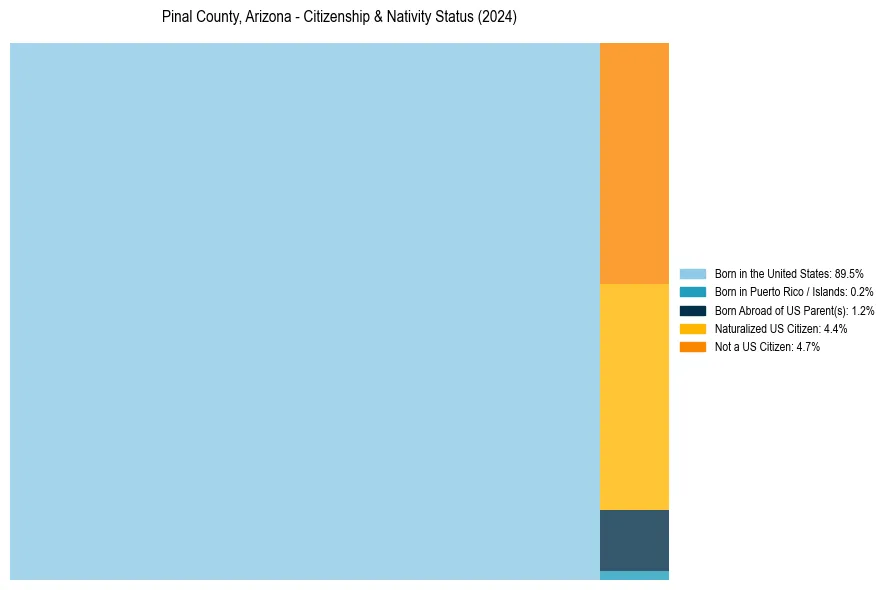
Pinal County, Arizona Nativity & Citizenship Distribution
Pinal County, Arizona Historical Nativity Trends (2010–2024)
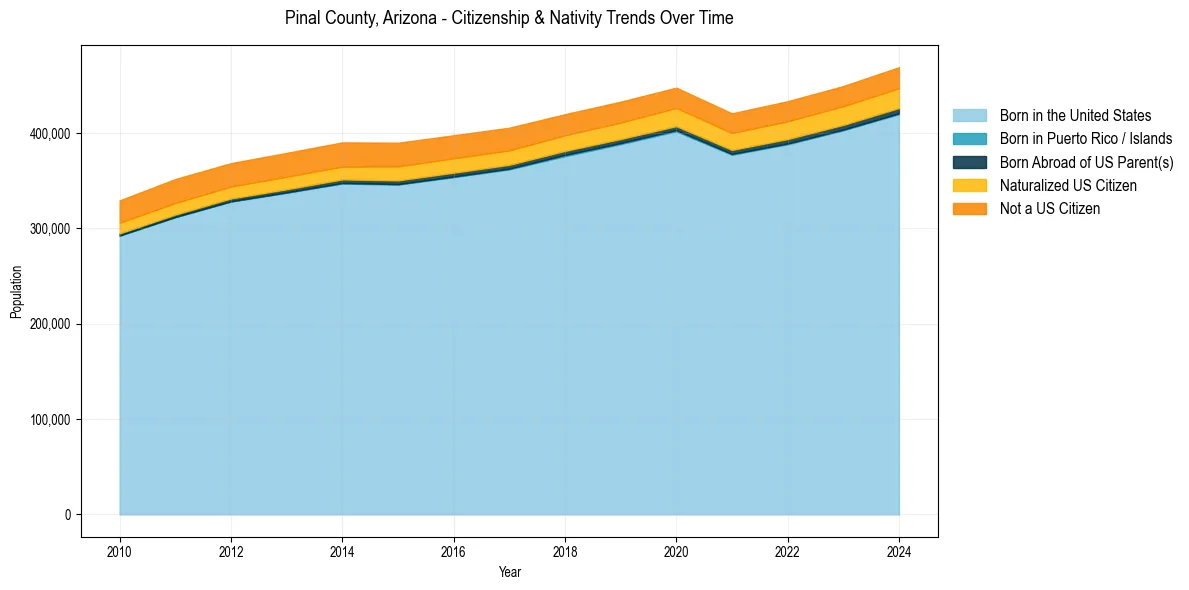
Pinal County, Arizona Population & Nativity History
| Year | Total Pop | Foreign Born | Native Born |
|---|---|---|---|
| 2024 | 469,006 | 9.1% | 90.9% |
| 2023 | 449,219 | 9.1% | 90.9% |
| 2022 | 433,338 | 9.2% | 90.8% |
| 2021 | 420,625 | 9.1% | 90.9% |
| 2020 | 447,559 | 9.0% | 91.0% |
| 2019 | 432,793 | 9.0% | 91.0% |
| 2018 | 419,721 | 9.2% | 90.8% |
| 2017 | 405,537 | 9.6% | 90.4% |
| 2016 | 397,604 | 9.9% | 90.1% |
| 2015 | 389,772 | 10.1% | 89.9% |
| 2014 | 390,160 | 10.0% | 90.0% |
| 2013 | 379,128 | 10.1% | 89.9% |
| 2012 | 368,374 | 10.1% | 89.9% |
| 2011 | 351,709 | 10.6% | 89.4% |
| 2010 | 329,297 | 10.5% | 89.5% |
Nativity & Citizenship FAQs for Pinal County, Arizona
Approximately 9.1% of residents in Pinal County, Arizona were born outside the United States.
The vast majority of residents, roughly 95.3%, are U.S. citizens (including both native-born and naturalized citizens).