Pima County, Arizona Nativity & Citizenship Status (2024)
Place of birth and citizenship status analysis for Pima County, Arizona
Pima County, Arizona Nativity & Citizenship Indicators (2024)
Native Born
88.2%
Foreign Born
11.8%
Naturalized
6.5%
US Citizens
94.8%
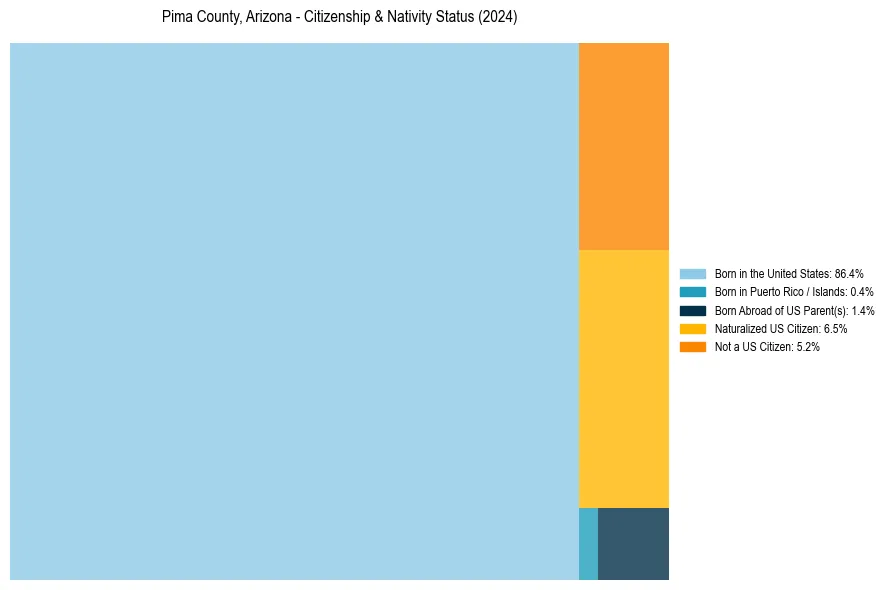
Pima County, Arizona Nativity & Citizenship Distribution
Pima County, Arizona Historical Nativity Trends (2010–2024)
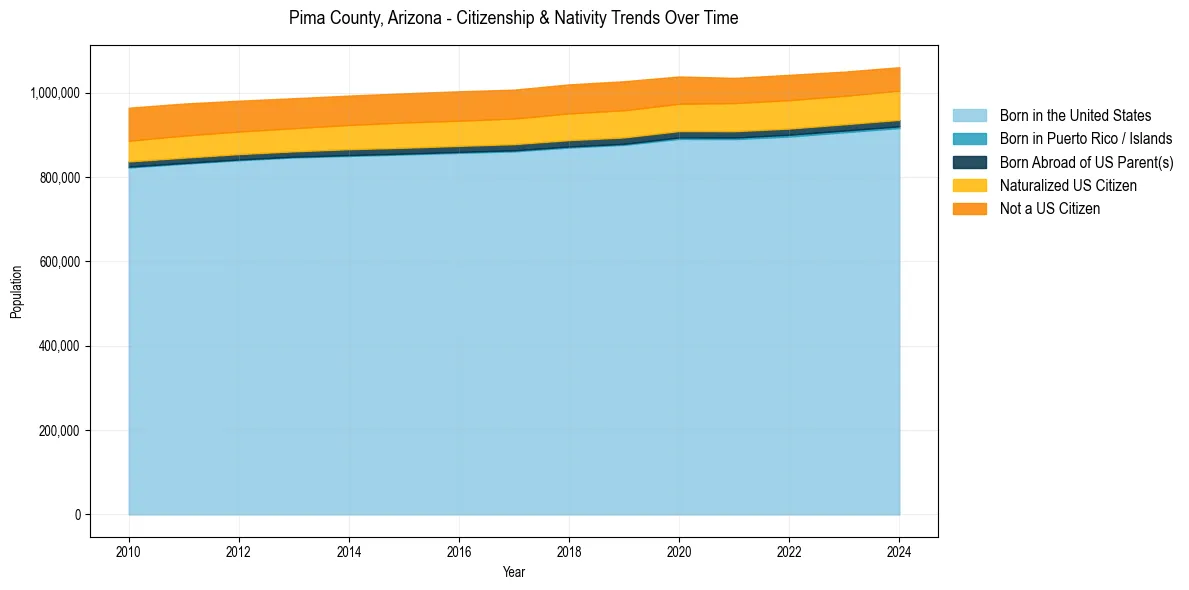
Pima County, Arizona Population & Nativity History
| Year | Total Pop | Foreign Born | Native Born |
|---|---|---|---|
| 2024 | 1,060,490 | 11.8% | 88.2% |
| 2023 | 1,049,947 | 11.9% | 88.1% |
| 2022 | 1,042,393 | 12.2% | 87.8% |
| 2021 | 1,035,063 | 12.2% | 87.8% |
| 2020 | 1,038,476 | 12.5% | 87.5% |
| 2019 | 1,027,207 | 13.0% | 87.0% |
| 2018 | 1,019,722 | 13.0% | 87.0% |
| 2017 | 1,007,257 | 12.8% | 87.2% |
| 2016 | 1,003,338 | 12.9% | 87.1% |
| 2015 | 998,537 | 12.9% | 87.1% |
| 2014 | 993,144 | 12.8% | 87.2% |
| 2013 | 986,891 | 12.8% | 87.2% |
| 2012 | 981,048 | 12.9% | 87.1% |
| 2011 | 974,181 | 13.2% | 86.8% |
| 2010 | 964,462 | 13.2% | 86.8% |
Nativity & Citizenship FAQs for Pima County, Arizona
Approximately 11.8% of residents in Pima County, Arizona were born outside the United States.
The vast majority of residents, roughly 94.8%, are U.S. citizens (including both native-born and naturalized citizens).