Arizona Nativity & Citizenship Status (2024)
Place of birth and citizenship status analysis for Arizona
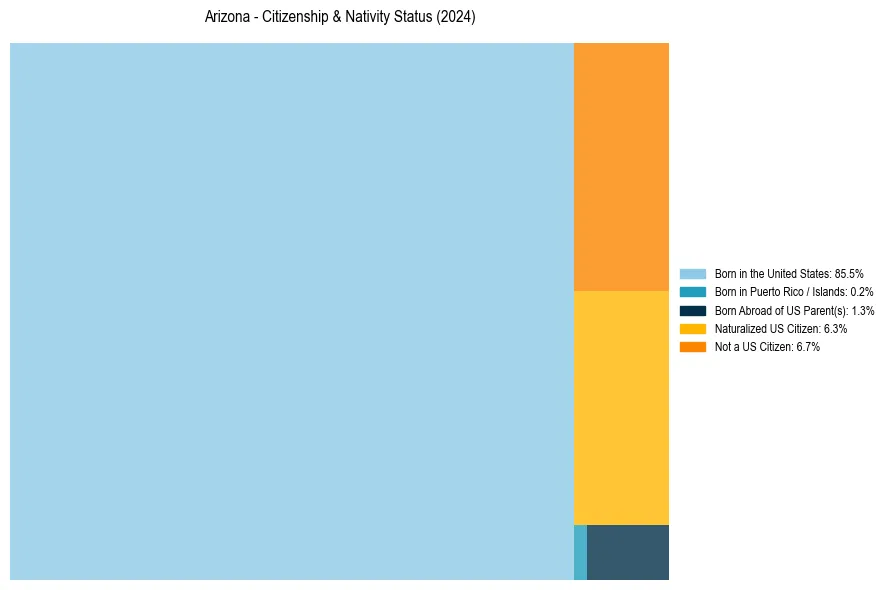
Arizona Nativity & Citizenship Indicators (2024)
Native Born
87.0%
Foreign Born
13.0%
Naturalized
6.3%
US Citizens
93.3%
Arizona Nativity & Citizenship Distribution
Arizona Historical Nativity Trends (2010–2024)
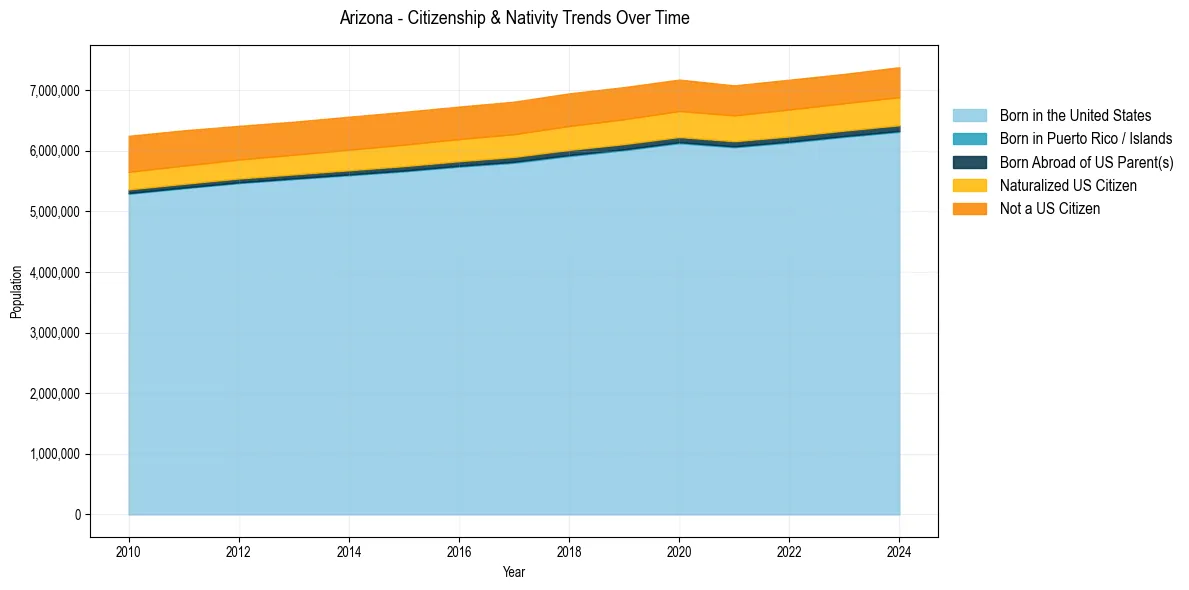
Arizona Population & Nativity History
| Year | Total Pop | Foreign Born | Native Born |
|---|---|---|---|
| 2024 | 7,378,838 | 13.0% | 87.0% |
| 2023 | 7,268,175 | 12.9% | 87.1% |
| 2022 | 7,172,282 | 13.0% | 87.0% |
| 2021 | 7,079,203 | 13.0% | 87.0% |
| 2020 | 7,174,064 | 13.2% | 86.8% |
| 2019 | 7,050,299 | 13.3% | 86.7% |
| 2018 | 6,946,685 | 13.4% | 86.6% |
| 2017 | 6,809,946 | 13.4% | 86.6% |
| 2016 | 6,728,577 | 13.4% | 86.6% |
| 2015 | 6,641,928 | 13.5% | 86.5% |
| 2014 | 6,561,516 | 13.5% | 86.5% |
| 2013 | 6,479,703 | 13.4% | 86.6% |
| 2012 | 6,410,979 | 13.6% | 86.4% |
| 2011 | 6,337,373 | 13.9% | 86.1% |
| 2010 | 6,246,816 | 14.2% | 85.8% |
Nativity & Citizenship FAQs for Arizona
Approximately 13.0% of residents in Arizona were born outside the United States.
The vast majority of residents, roughly 93.3%, are U.S. citizens (including both native-born and naturalized citizens).