Maricopa County, Arizona Nativity & Citizenship Status (2024)
Place of birth and citizenship status analysis for Maricopa County, Arizona
Maricopa County, Arizona Nativity & Citizenship Indicators (2024)
Native Born
85.5%
Foreign Born
14.5%
Naturalized
6.7%
US Citizens
92.2%
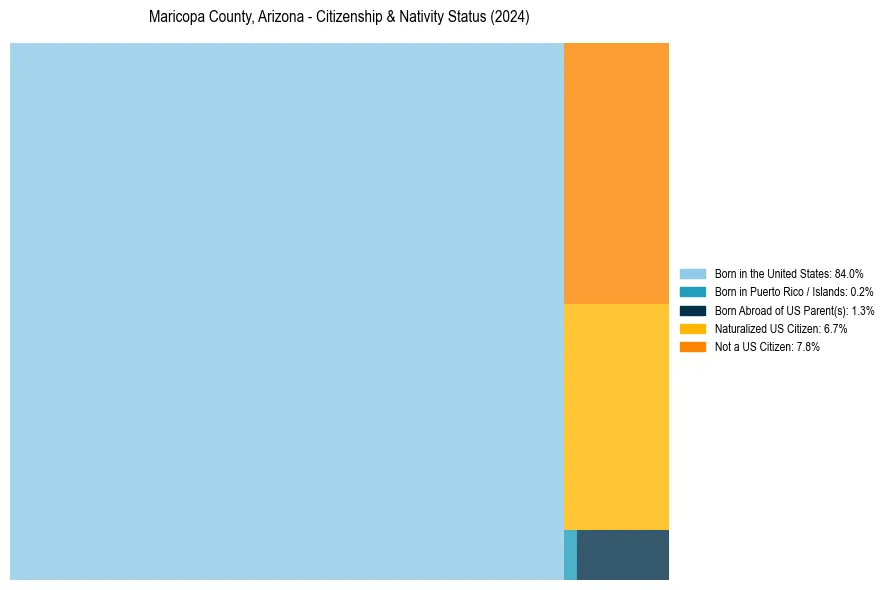
Maricopa County, Arizona Nativity & Citizenship Distribution
Maricopa County, Arizona Historical Nativity Trends (2010–2024)
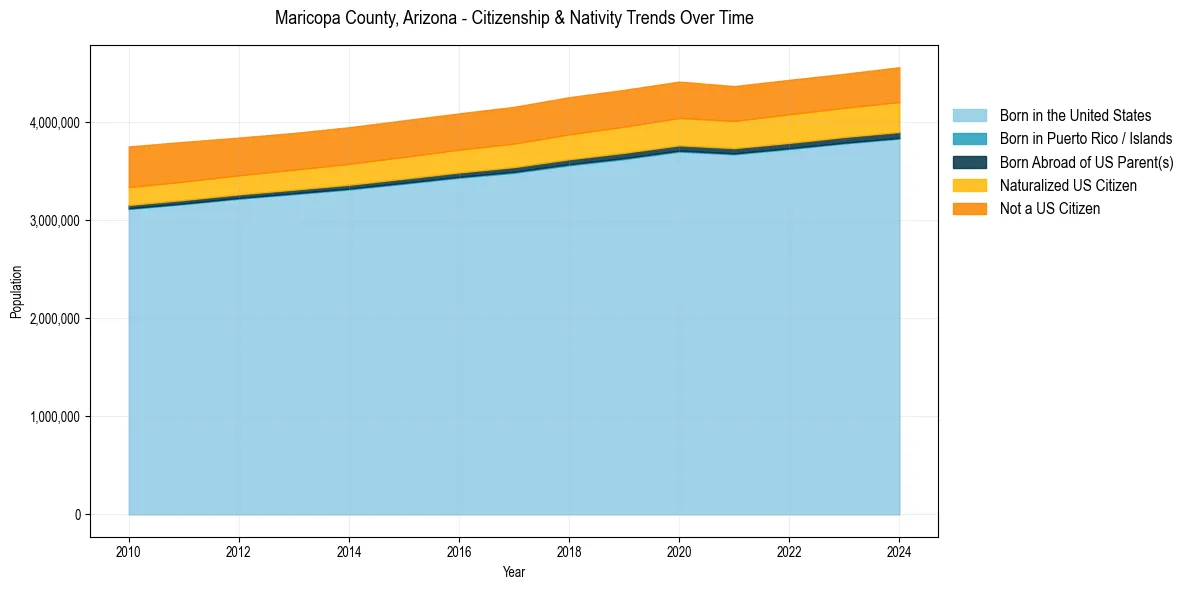
Maricopa County, Arizona Population & Nativity History
| Year | Total Pop | Foreign Born | Native Born |
|---|---|---|---|
| 2024 | 4,559,748 | 14.5% | 85.5% |
| 2023 | 4,491,987 | 14.3% | 85.7% |
| 2022 | 4,430,871 | 14.5% | 85.5% |
| 2021 | 4,367,186 | 14.5% | 85.5% |
| 2020 | 4,412,779 | 14.7% | 85.3% |
| 2019 | 4,328,810 | 14.8% | 85.2% |
| 2018 | 4,253,913 | 14.9% | 85.1% |
| 2017 | 4,155,501 | 14.8% | 85.2% |
| 2016 | 4,088,549 | 14.7% | 85.3% |
| 2015 | 4,018,143 | 14.8% | 85.2% |
| 2014 | 3,947,382 | 14.9% | 85.1% |
| 2013 | 3,889,161 | 14.9% | 85.1% |
| 2012 | 3,841,819 | 15.1% | 84.9% |
| 2011 | 3,798,374 | 15.6% | 84.4% |
| 2010 | 3,751,410 | 15.9% | 84.1% |
Nativity & Citizenship FAQs for Maricopa County, Arizona
Approximately 14.5% of residents in Maricopa County, Arizona were born outside the United States.
The vast majority of residents, roughly 92.2%, are U.S. citizens (including both native-born and naturalized citizens).