Coconino County, Arizona Nativity & Citizenship Status (2024)
Place of birth and citizenship status analysis for Coconino County, Arizona
Coconino County, Arizona Nativity & Citizenship Indicators (2024)
Native Born
95.0%
Foreign Born
5.0%
Naturalized
2.3%
US Citizens
97.3%
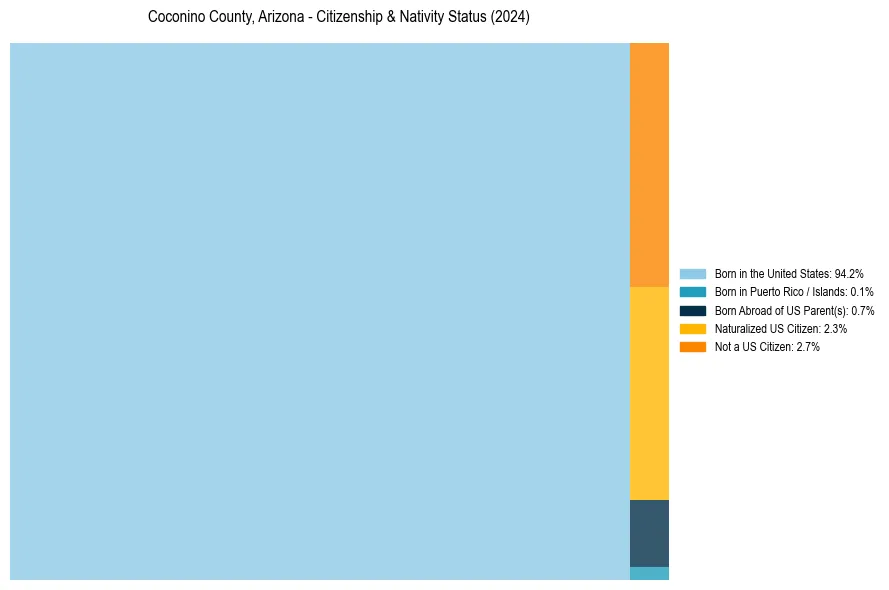
Coconino County, Arizona Nativity & Citizenship Distribution
Coconino County, Arizona Historical Nativity Trends (2010–2024)
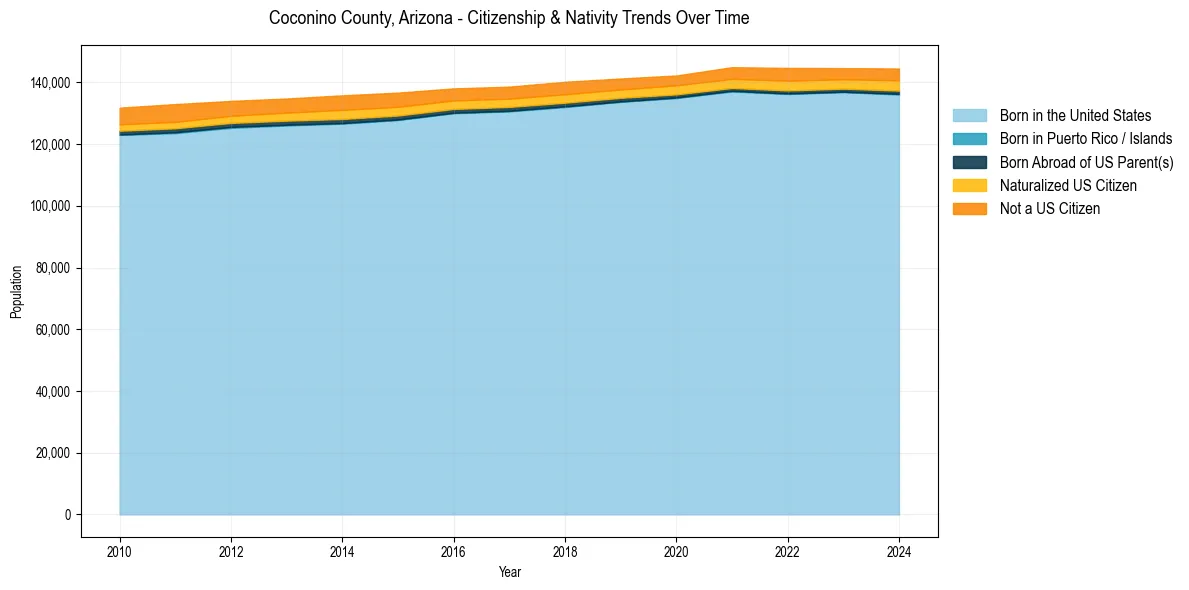
Coconino County, Arizona Population & Nativity History
| Year | Total Pop | Foreign Born | Native Born |
|---|---|---|---|
| 2024 | 144,508 | 5.0% | 95.0% |
| 2023 | 144,643 | 4.6% | 95.4% |
| 2022 | 144,705 | 5.1% | 94.9% |
| 2021 | 144,942 | 4.6% | 95.4% |
| 2020 | 142,254 | 4.3% | 95.7% |
| 2019 | 141,274 | 4.4% | 95.6% |
| 2018 | 140,217 | 4.8% | 95.2% |
| 2017 | 138,639 | 4.7% | 95.3% |
| 2016 | 138,064 | 4.8% | 95.2% |
| 2015 | 136,701 | 5.4% | 94.6% |
| 2014 | 135,817 | 5.6% | 94.4% |
| 2013 | 134,795 | 5.3% | 94.7% |
| 2012 | 134,011 | 5.3% | 94.7% |
| 2011 | 132,978 | 5.9% | 94.1% |
| 2010 | 131,824 | 5.7% | 94.3% |
Nativity & Citizenship FAQs for Coconino County, Arizona
Approximately 5.0% of residents in Coconino County, Arizona were born outside the United States.
The vast majority of residents, roughly 97.3%, are U.S. citizens (including both native-born and naturalized citizens).