Cochise County, Arizona Nativity & Citizenship Status (2024)
Place of birth and citizenship status analysis for Cochise County, Arizona
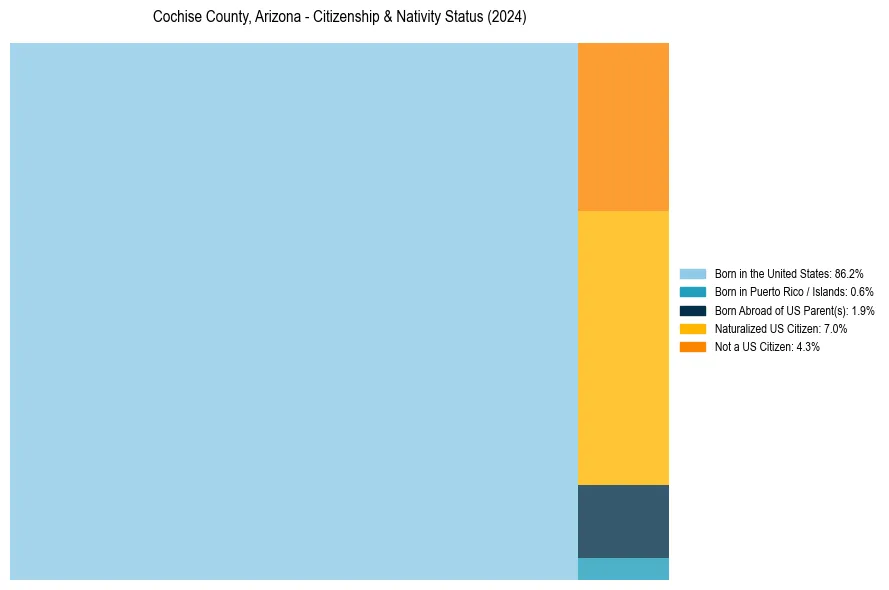
Cochise County, Arizona Nativity & Citizenship Indicators (2024)
Native Born
88.7%
Foreign Born
11.3%
Naturalized
7.0%
US Citizens
95.7%
Cochise County, Arizona Nativity & Citizenship Distribution
Cochise County, Arizona Historical Nativity Trends (2010–2024)
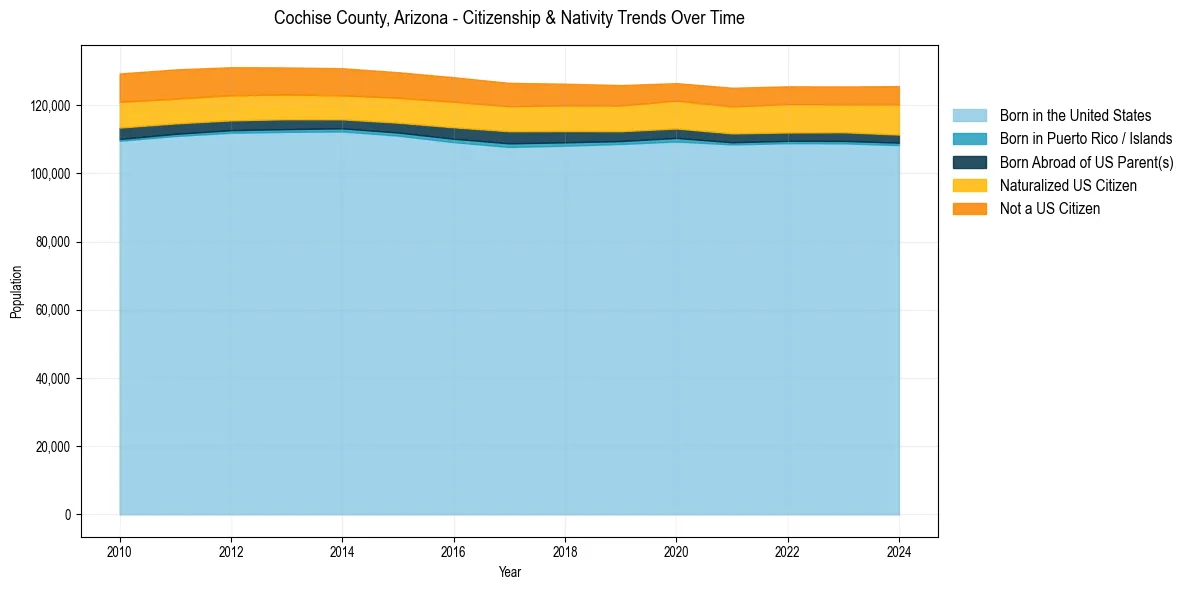
Cochise County, Arizona Population & Nativity History
| Year | Total Pop | Foreign Born | Native Born |
|---|---|---|---|
| 2024 | 125,566 | 11.3% | 88.7% |
| 2023 | 125,458 | 10.7% | 89.3% |
| 2022 | 125,504 | 10.8% | 89.2% |
| 2021 | 125,092 | 10.7% | 89.3% |
| 2020 | 126,442 | 10.5% | 89.5% |
| 2019 | 125,867 | 10.7% | 89.3% |
| 2018 | 126,279 | 11.0% | 89.0% |
| 2017 | 126,516 | 11.2% | 88.8% |
| 2016 | 128,177 | 11.5% | 88.5% |
| 2015 | 129,647 | 11.4% | 88.6% |
| 2014 | 130,807 | 11.5% | 88.5% |
| 2013 | 131,038 | 11.6% | 88.4% |
| 2012 | 131,118 | 11.9% | 88.1% |
| 2011 | 130,464 | 12.1% | 87.9% |
| 2010 | 129,268 | 12.3% | 87.7% |
Nativity & Citizenship FAQs for Cochise County, Arizona
Approximately 11.3% of residents in Cochise County, Arizona were born outside the United States.
The vast majority of residents, roughly 95.7%, are U.S. citizens (including both native-born and naturalized citizens).