North Slope Borough, Alaska Nativity & Citizenship Status (2024)
Place of birth and citizenship status analysis for North Slope Borough, Alaska
North Slope Borough, Alaska Nativity & Citizenship Indicators (2024)
Native Born
93.2%
Foreign Born
6.8%
Naturalized
3.2%
US Citizens
96.4%
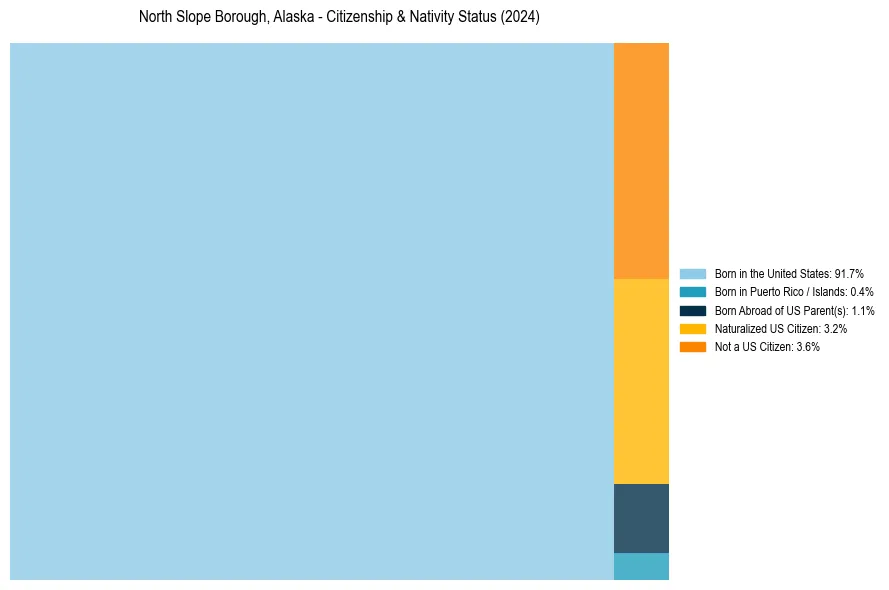
North Slope Borough, Alaska Nativity & Citizenship Distribution
North Slope Borough, Alaska Historical Nativity Trends (2010–2024)
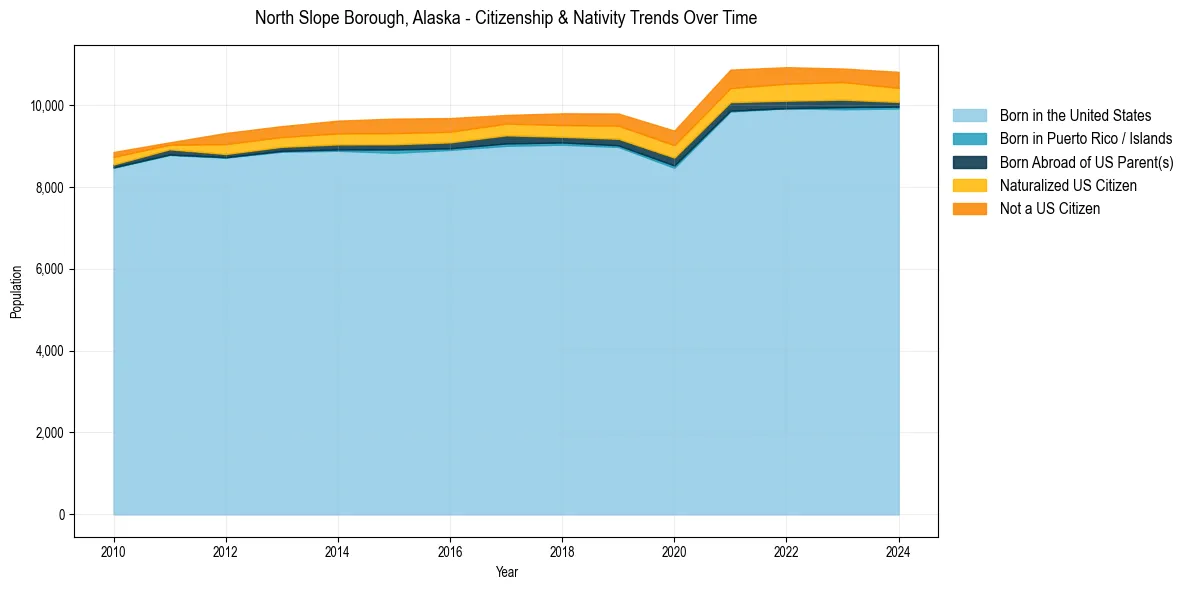
North Slope Borough, Alaska Population & Nativity History
| Year | Total Pop | Foreign Born | Native Born |
|---|---|---|---|
| 2024 | 10,810 | 6.8% | 93.2% |
| 2023 | 10,891 | 7.0% | 93.0% |
| 2022 | 10,924 | 7.5% | 92.5% |
| 2021 | 10,865 | 7.3% | 92.7% |
| 2020 | 9,375 | 7.0% | 93.0% |
| 2019 | 9,792 | 6.3% | 93.7% |
| 2018 | 9,797 | 5.9% | 94.1% |
| 2017 | 9,757 | 5.1% | 94.9% |
| 2016 | 9,681 | 6.1% | 93.9% |
| 2015 | 9,667 | 6.5% | 93.5% |
| 2014 | 9,618 | 6.0% | 94.0% |
| 2013 | 9,484 | 5.3% | 94.7% |
| 2012 | 9,317 | 5.5% | 94.5% |
| 2011 | 9,088 | 1.9% | 98.1% |
| 2010 | 8,852 | 3.4% | 96.6% |
Nativity & Citizenship FAQs for North Slope Borough, Alaska
Approximately 6.8% of residents in North Slope Borough, Alaska were born outside the United States.
The vast majority of residents, roughly 96.4%, are U.S. citizens (including both native-born and naturalized citizens).