Anchorage Municipality, Alaska Nativity & Citizenship Status (2024)
Place of birth and citizenship status analysis for Anchorage Municipality, Alaska
Anchorage Municipality, Alaska Nativity & Citizenship Indicators (2024)
Native Born
89.1%
Foreign Born
10.9%
Naturalized
7.1%
US Citizens
96.3%
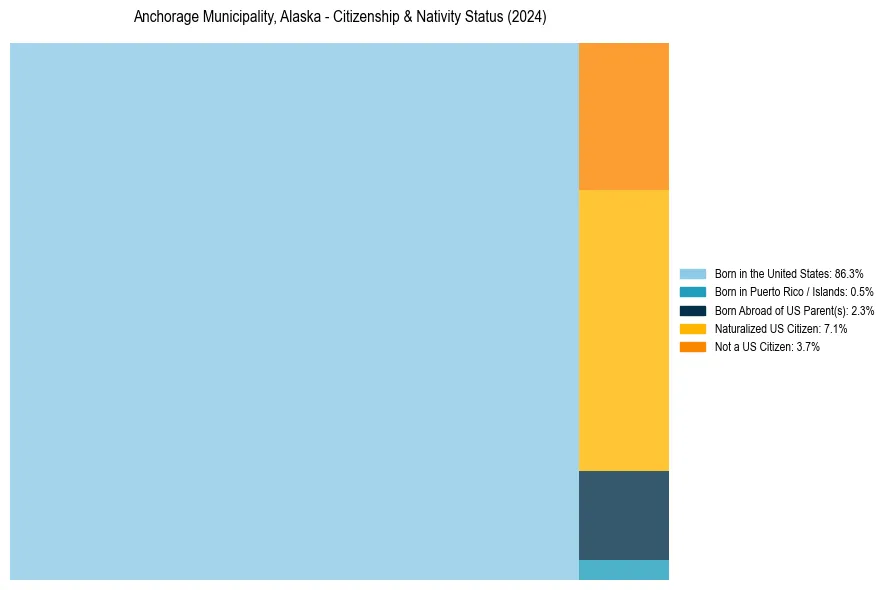
Anchorage Municipality, Alaska Nativity & Citizenship Distribution
Anchorage Municipality, Alaska Historical Nativity Trends (2010–2024)
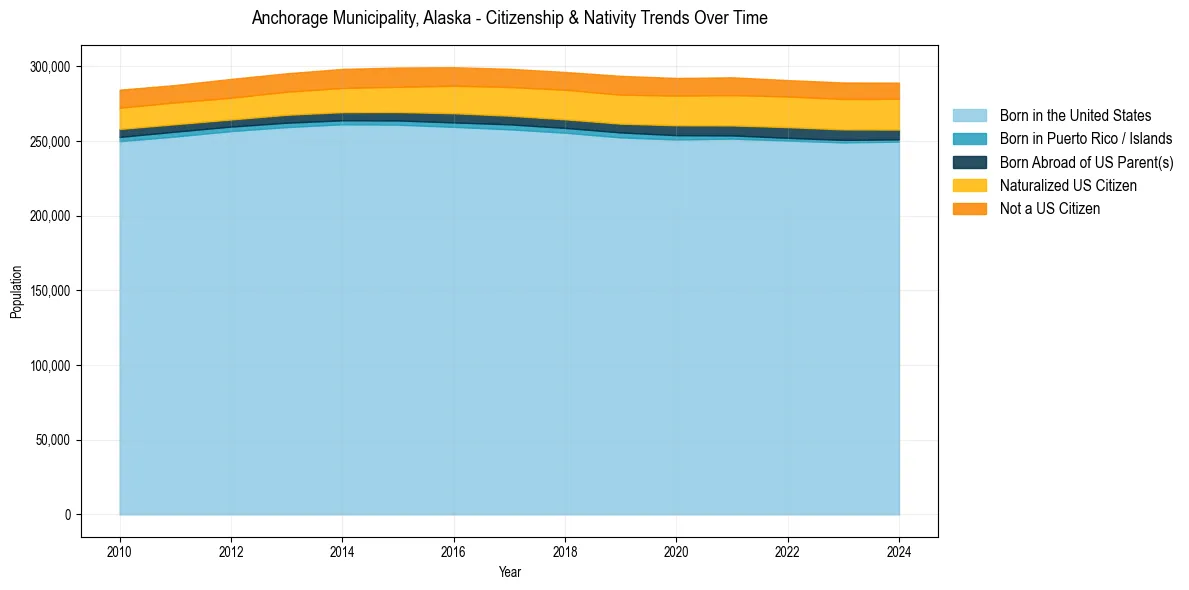
Anchorage Municipality, Alaska Population & Nativity History
| Year | Total Pop | Foreign Born | Native Born |
|---|---|---|---|
| 2024 | 288,976 | 10.9% | 89.1% |
| 2023 | 289,069 | 10.9% | 89.1% |
| 2022 | 290,674 | 10.8% | 89.2% |
| 2021 | 292,545 | 11.0% | 89.0% |
| 2020 | 292,090 | 10.8% | 89.2% |
| 2019 | 293,531 | 10.9% | 89.1% |
| 2018 | 296,112 | 10.7% | 89.3% |
| 2017 | 298,225 | 10.5% | 89.5% |
| 2016 | 299,321 | 10.3% | 89.7% |
| 2015 | 299,107 | 10.0% | 90.0% |
| 2014 | 298,178 | 9.7% | 90.3% |
| 2013 | 295,237 | 9.4% | 90.6% |
| 2012 | 291,470 | 9.3% | 90.7% |
| 2011 | 287,390 | 9.1% | 90.9% |
| 2010 | 284,267 | 9.2% | 90.8% |
Nativity & Citizenship FAQs for Anchorage Municipality, Alaska
Approximately 10.9% of residents in Anchorage Municipality, Alaska were born outside the United States.
The vast majority of residents, roughly 96.3%, are U.S. citizens (including both native-born and naturalized citizens).