St. Clair County, Alabama Nativity & Citizenship Status (2024)
Place of birth and citizenship status analysis for St. Clair County, Alabama
St. Clair County, Alabama Nativity & Citizenship Indicators (2024)
Native Born
98.3%
Foreign Born
1.7%
Naturalized
0.9%
US Citizens
99.2%
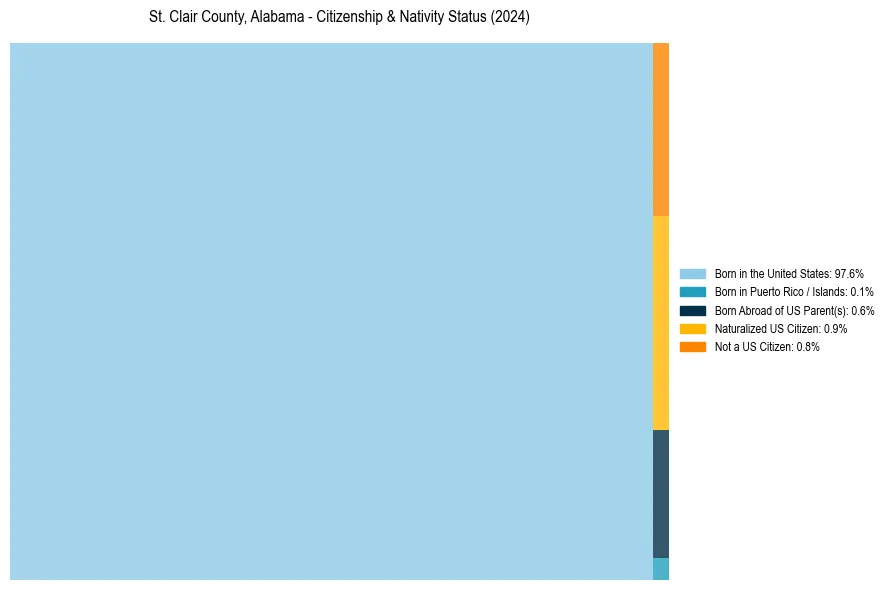
St. Clair County, Alabama Nativity & Citizenship Distribution
St. Clair County, Alabama Historical Nativity Trends (2010–2024)
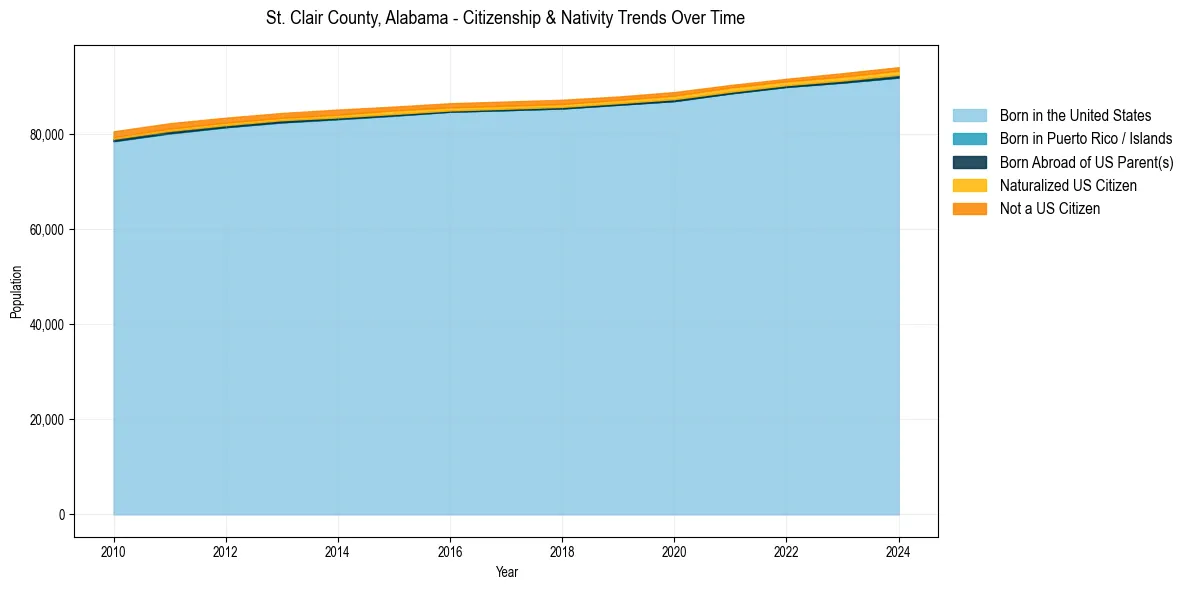
St. Clair County, Alabama Population & Nativity History
| Year | Total Pop | Foreign Born | Native Born |
|---|---|---|---|
| 2024 | 94,166 | 1.7% | 98.3% |
| 2023 | 92,903 | 1.7% | 98.3% |
| 2022 | 91,719 | 1.5% | 98.5% |
| 2021 | 90,412 | 1.6% | 98.4% |
| 2020 | 88,929 | 1.7% | 98.3% |
| 2019 | 87,989 | 1.6% | 98.4% |
| 2018 | 87,306 | 1.7% | 98.3% |
| 2017 | 86,937 | 1.7% | 98.3% |
| 2016 | 86,576 | 1.8% | 98.2% |
| 2015 | 85,864 | 1.8% | 98.2% |
| 2014 | 85,242 | 1.9% | 98.1% |
| 2013 | 84,521 | 1.8% | 98.2% |
| 2012 | 83,530 | 1.9% | 98.1% |
| 2011 | 82,363 | 1.9% | 98.1% |
| 2010 | 80,658 | 1.9% | 98.1% |
Nativity & Citizenship FAQs for St. Clair County, Alabama
Approximately 1.7% of residents in St. Clair County, Alabama were born outside the United States.
The vast majority of residents, roughly 99.2%, are U.S. citizens (including both native-born and naturalized citizens).