Macon County, Alabama Race & Ethnicity Demographics (2024)
Racial distribution and diversity statistics for Macon County, Alabama
Macon County, Alabama Diversity Indicators (2024)
Total Population
18,691
Diversity Score
37.0
Diversity Tier
Moderate-Low
Largest Group
Black / African American
77.5%%
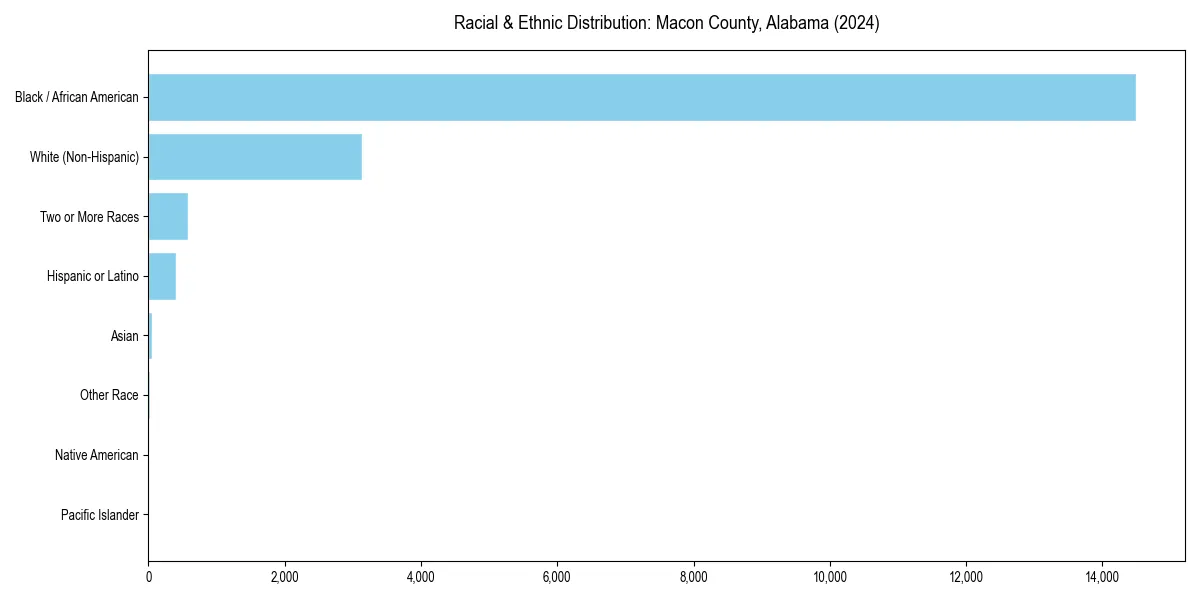
Macon County, Alabama Racial & Ethnic Breakdown
Macon County, Alabama Historical Diversity Trend (2010–2024)
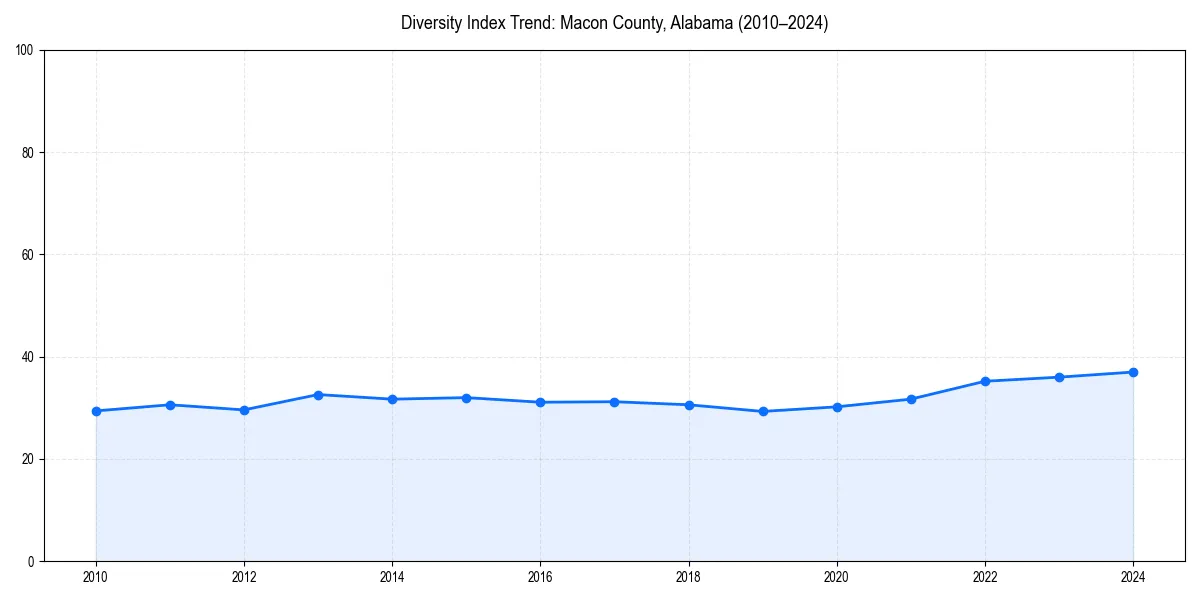
Since 2010, the diversity index of Macon County, Alabama has increased significantly.
Macon County, Alabama Population by Race & Ethnicity
| Race / Ethnicity | Population | Percentage |
|---|---|---|
| Black / African American | 14,488 | 77.5% |
| White (Non-Hispanic) | 3,137 | 16.8% |
| Two or More Races | 577 | 3.1% |
| Hispanic or Latino | 408 | 2.2% |
| Asian | 55 | 0.3% |
| Other Race | 20 | 0.1% |
| Native American | 6 | 0.0% |
| Pacific Islander | 0 | 0.0% |
Diversity & Demographics FAQs for Macon County, Alabama
The largest racial or ethnic group in Macon County, Alabama is Black / African American, which makes up 77.5% of the total population.
Since 2010, the diversity index for Macon County, Alabama has increased significantly. The area currently has a diversity score of 37.0/100, which is considered a Moderate-Low level of diversity.