Limestone County, Alabama Nativity & Citizenship Status (2024)
Place of birth and citizenship status analysis for Limestone County, Alabama
Limestone County, Alabama Nativity & Citizenship Indicators (2024)
Native Born
95.9%
Foreign Born
4.1%
Naturalized
2.0%
US Citizens
97.9%
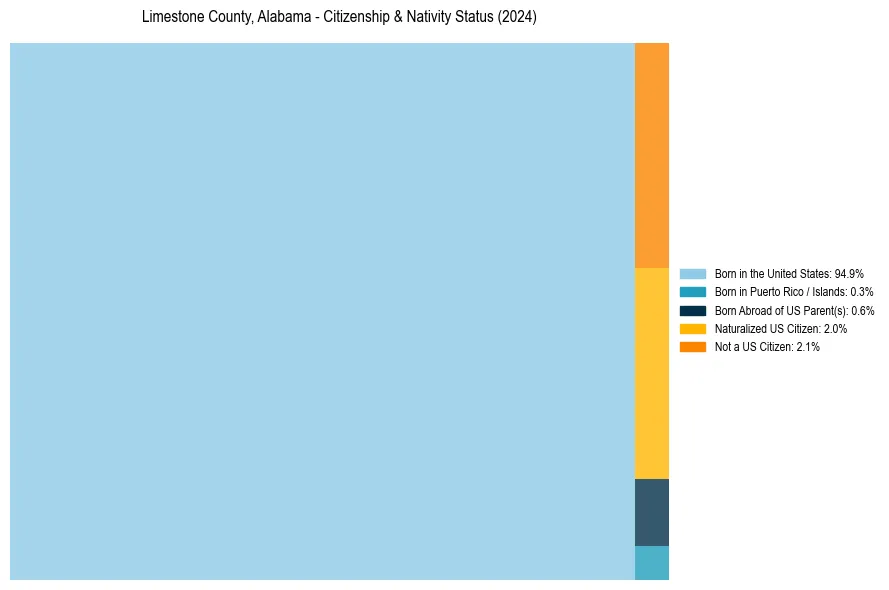
Limestone County, Alabama Nativity & Citizenship Distribution
Limestone County, Alabama Historical Nativity Trends (2010–2024)
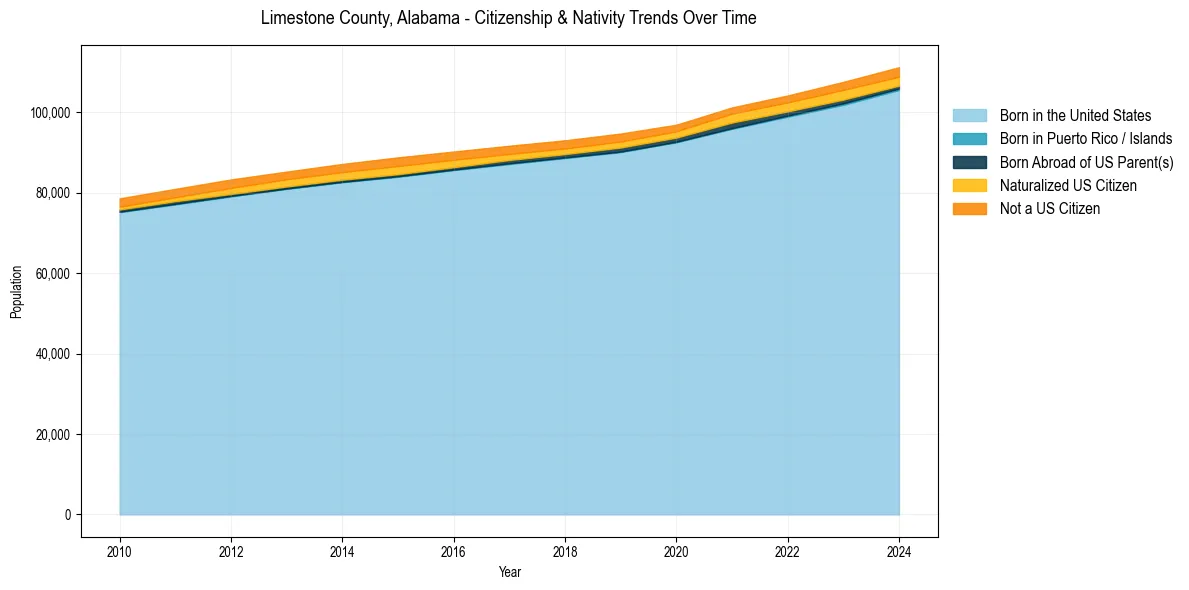
Limestone County, Alabama Population & Nativity History
| Year | Total Pop | Foreign Born | Native Born |
|---|---|---|---|
| 2024 | 111,233 | 4.1% | 95.9% |
| 2023 | 107,577 | 4.1% | 95.9% |
| 2022 | 104,199 | 3.8% | 96.2% |
| 2021 | 101,217 | 3.7% | 96.3% |
| 2020 | 96,921 | 3.3% | 96.7% |
| 2019 | 94,727 | 3.7% | 96.3% |
| 2018 | 93,052 | 3.7% | 96.3% |
| 2017 | 91,695 | 3.9% | 96.1% |
| 2016 | 90,257 | 4.3% | 95.7% |
| 2015 | 88,805 | 4.7% | 95.3% |
| 2014 | 87,167 | 4.5% | 95.5% |
| 2013 | 85,264 | 4.3% | 95.7% |
| 2012 | 83,313 | 4.3% | 95.7% |
| 2011 | 80,966 | 3.8% | 96.2% |
| 2010 | 78,614 | 3.5% | 96.5% |
Nativity & Citizenship FAQs for Limestone County, Alabama
Approximately 4.1% of residents in Limestone County, Alabama were born outside the United States.
The vast majority of residents, roughly 97.9%, are U.S. citizens (including both native-born and naturalized citizens).