Lee County, Alabama Nativity & Citizenship Status (2024)
Place of birth and citizenship status analysis for Lee County, Alabama
Lee County, Alabama Nativity & Citizenship Indicators (2024)
Native Born
93.0%
Foreign Born
7.0%
Naturalized
2.1%
US Citizens
95.1%
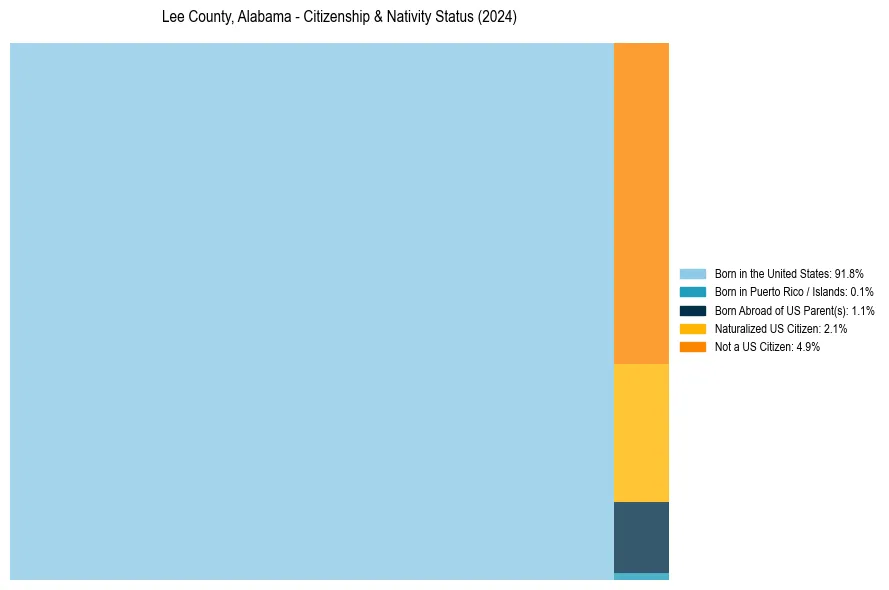
Lee County, Alabama Nativity & Citizenship Distribution
Lee County, Alabama Historical Nativity Trends (2010–2024)
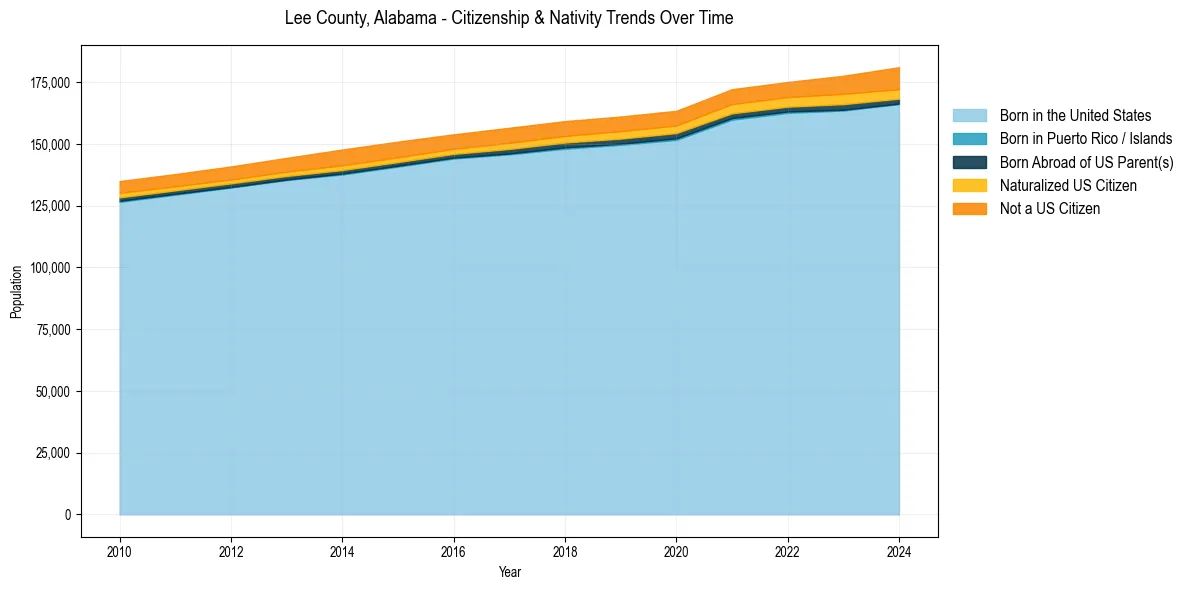
Lee County, Alabama Population & Nativity History
| Year | Total Pop | Foreign Born | Native Born |
|---|---|---|---|
| 2024 | 181,134 | 7.0% | 93.0% |
| 2023 | 177,663 | 6.5% | 93.5% |
| 2022 | 175,126 | 5.7% | 94.3% |
| 2021 | 172,223 | 5.7% | 94.3% |
| 2020 | 163,461 | 5.5% | 94.5% |
| 2019 | 161,152 | 5.6% | 94.4% |
| 2018 | 159,287 | 5.5% | 94.5% |
| 2017 | 156,597 | 5.5% | 94.5% |
| 2016 | 153,947 | 5.2% | 94.8% |
| 2015 | 150,982 | 5.5% | 94.5% |
| 2014 | 147,790 | 5.6% | 94.4% |
| 2013 | 144,405 | 5.1% | 94.9% |
| 2012 | 140,938 | 4.9% | 95.1% |
| 2011 | 137,855 | 4.8% | 95.2% |
| 2010 | 135,010 | 4.9% | 95.1% |
Nativity & Citizenship FAQs for Lee County, Alabama
Approximately 7.0% of residents in Lee County, Alabama were born outside the United States.
The vast majority of residents, roughly 95.1%, are U.S. citizens (including both native-born and naturalized citizens).