Elmore County, Alabama Nativity & Citizenship Status (2024)
Place of birth and citizenship status analysis for Elmore County, Alabama
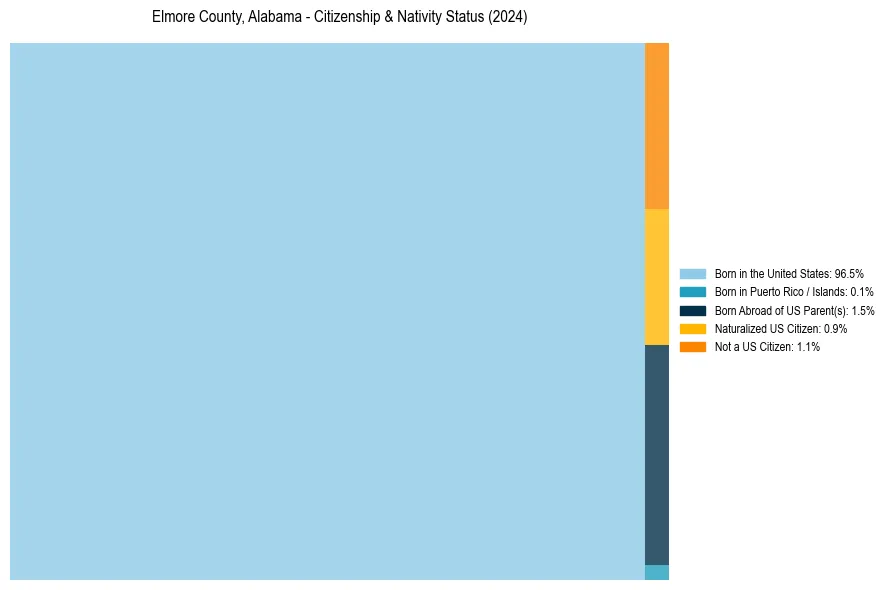
Elmore County, Alabama Nativity & Citizenship Indicators (2024)
Native Born
98.0%
Foreign Born
2.0%
Naturalized
0.9%
US Citizens
98.9%
Elmore County, Alabama Nativity & Citizenship Distribution
Elmore County, Alabama Historical Nativity Trends (2010–2024)
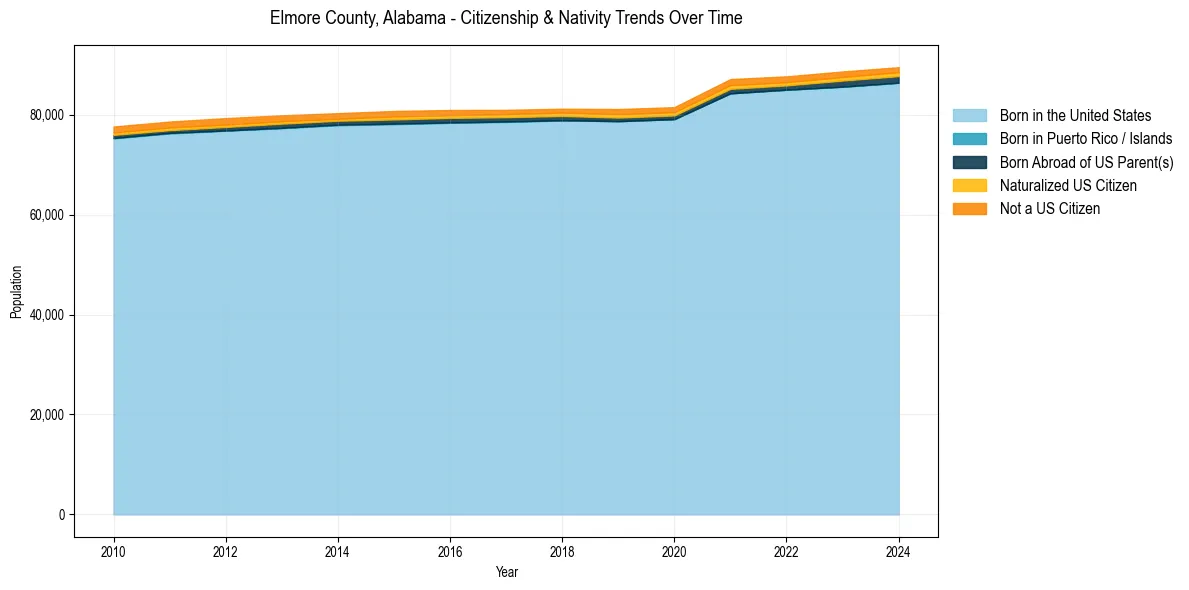
Elmore County, Alabama Population & Nativity History
| Year | Total Pop | Foreign Born | Native Born |
|---|---|---|---|
| 2024 | 89,526 | 2.0% | 98.0% |
| 2023 | 88,669 | 2.1% | 97.9% |
| 2022 | 87,694 | 2.1% | 97.9% |
| 2021 | 87,146 | 2.2% | 97.8% |
| 2020 | 81,526 | 2.0% | 98.0% |
| 2019 | 81,144 | 2.1% | 97.9% |
| 2018 | 81,212 | 1.8% | 98.2% |
| 2017 | 80,989 | 1.8% | 98.2% |
| 2016 | 80,957 | 2.0% | 98.0% |
| 2015 | 80,763 | 2.1% | 97.9% |
| 2014 | 80,321 | 1.9% | 98.1% |
| 2013 | 79,895 | 2.1% | 97.9% |
| 2012 | 79,330 | 2.2% | 97.8% |
| 2011 | 78,641 | 2.2% | 97.8% |
| 2010 | 77,650 | 2.2% | 97.8% |
Nativity & Citizenship FAQs for Elmore County, Alabama
Approximately 2.0% of residents in Elmore County, Alabama were born outside the United States.
The vast majority of residents, roughly 98.9%, are U.S. citizens (including both native-born and naturalized citizens).