Baldwin County, Alabama Nativity & Citizenship Status (2024)
Place of birth and citizenship status analysis for Baldwin County, Alabama
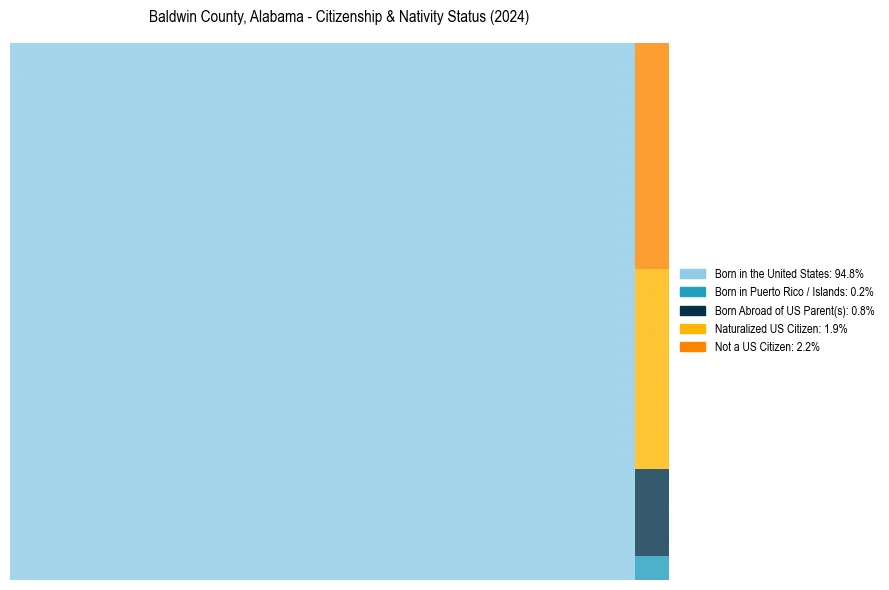
Baldwin County, Alabama Nativity & Citizenship Indicators (2024)
Native Born
95.9%
Foreign Born
4.1%
Naturalized
1.9%
US Citizens
97.8%
Baldwin County, Alabama Nativity & Citizenship Distribution
Baldwin County, Alabama Historical Nativity Trends (2010–2024)
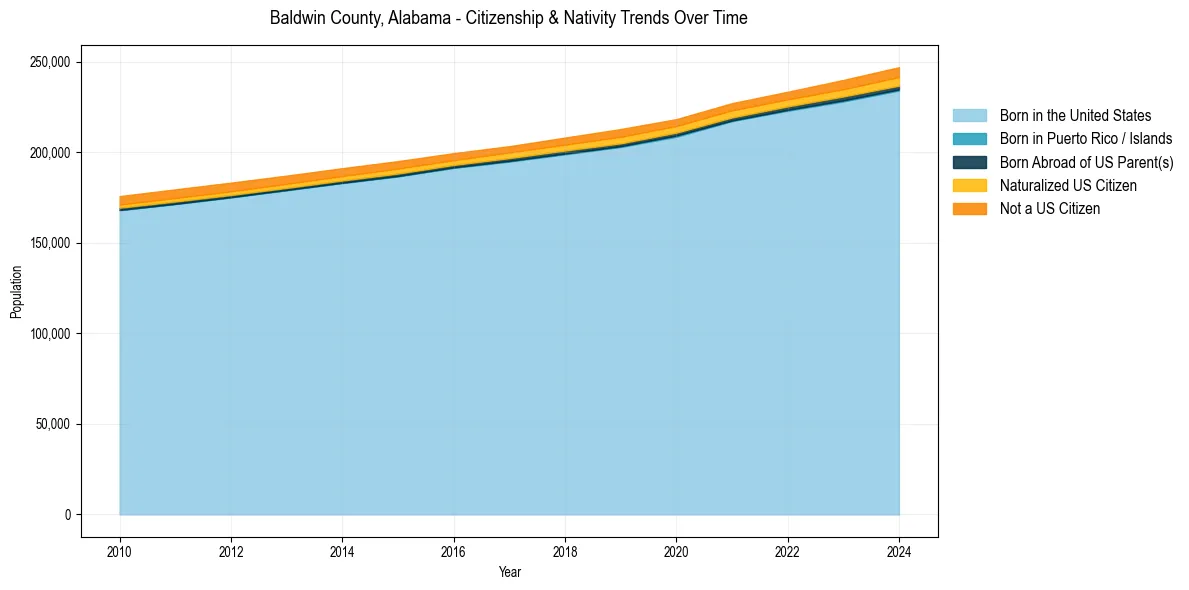
Baldwin County, Alabama Population & Nativity History
| Year | Total Pop | Foreign Born | Native Born |
|---|---|---|---|
| 2024 | 246,989 | 4.1% | 95.9% |
| 2023 | 239,945 | 3.8% | 96.2% |
| 2022 | 233,420 | 3.5% | 96.5% |
| 2021 | 227,131 | 3.5% | 96.5% |
| 2020 | 218,289 | 3.4% | 96.6% |
| 2019 | 212,830 | 3.7% | 96.3% |
| 2018 | 208,107 | 3.4% | 96.6% |
| 2017 | 203,360 | 3.2% | 96.8% |
| 2016 | 199,510 | 3.3% | 96.7% |
| 2015 | 195,121 | 3.5% | 96.5% |
| 2014 | 191,205 | 3.6% | 96.4% |
| 2013 | 187,114 | 3.6% | 96.4% |
| 2012 | 183,226 | 3.7% | 96.3% |
| 2011 | 179,523 | 3.7% | 96.3% |
| 2010 | 175,791 | 3.6% | 96.4% |
Nativity & Citizenship FAQs for Baldwin County, Alabama
Approximately 4.1% of residents in Baldwin County, Alabama were born outside the United States.
The vast majority of residents, roughly 97.8%, are U.S. citizens (including both native-born and naturalized citizens).