Get ready-to-use data, reports, analysis, and visualizations covering the demographics of Augusta County, Virginia based on the United States Census Bureau's 2023 American Community Survey (ACS) 5-Year Estimates.
Explore Topics
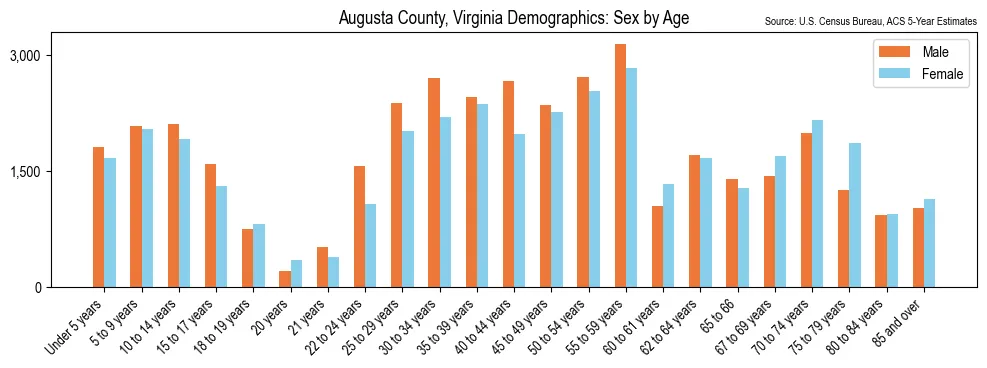
Augusta County, Virginia Demographics: Sex by Age
The chart below shows the age and gender distribution of the population in Augusta County, Virginia, based on the U.S. Census Bureau’s 2023 American Community Survey (ACS). The total population of Augusta County, Virginia is 77,713. The median age of the population is 44.0. The median age for males is 43.0 years and for females, it is 47.0 years. Of the total population, 4.47% are under 5 years old, and 14.22% are children between the ages of 5 and 17. 7.27% of the population are young adults aged 18 to 24, while 11.97% are in the 25 to 34 age bracket. 24.90% of the population falls between 35 and 54 years, 15.12% are aged 55 to 64, and 22.05% are 65 years and older.
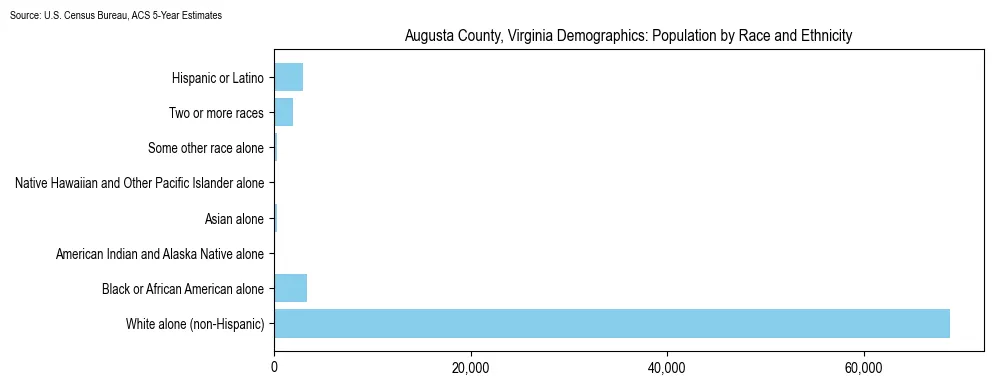
Augusta County, Virginia Demographics: Population by Race & Ethnicity
The chart shows the breakdown of the total population of Augusta County, Virginia by race and ethnicity (racial demographics), based on the U.S. Census Bureau’s 2023 American Community Survey (ACS). The breakdown is as follows: White: 88.39%; Black/African American: 4.26%; American Indian and Alaska Native: 0.16%; Asian: 0.41%; Native Hawaiian or Other Pacific Islander: 0.10%; Some other race: 0.43%; Two or more races: 2.47%; Hispanic or Latino: 3.77%.
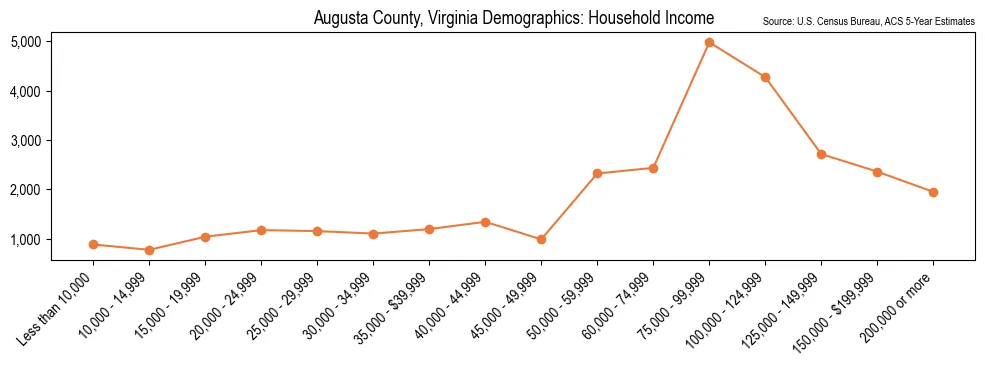
Augusta County, Virginia Demographics: Household Income
The median household income in Augusta County, Virginia in the past 12 months, in 2023 inflation-adjusted dollars, was $79,972. The chart below shows the distribution of household income in Augusta County, Virginia, based on data from the U.S. Census Bureau’s 2023 American Community Survey (ACS). 8.77% of households earn less than $20,000, 11.17% earn between $20,000 and $34,999, 11.47% fall between $35,000 and $49,999, 15.51% earn between $50,000 and $74,999, 39.03% earn between $75,000 and $149,999, and 14.05% of households earn $150,000 or more.
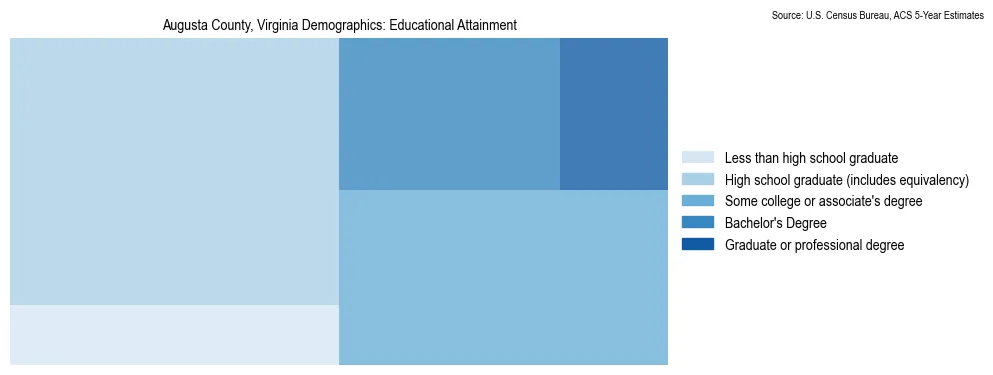
Augusta County, Virginia Demographics: Educational Attainment
The chart shows the breakdown of the total population, 25 and older, of Augusta County, Virginia by educational attainment, based on the U.S. Census Bureau’s 2023 American Community Survey (ACS). The breakdown is as follows: Less than high school graduate: 9.20%; High school graduate (includes equivalency): 40.80%; Some college or associate's degree: 26.72%; Bachelor's Degree: 15.59%; Graduate or professional degree: 7.69%.
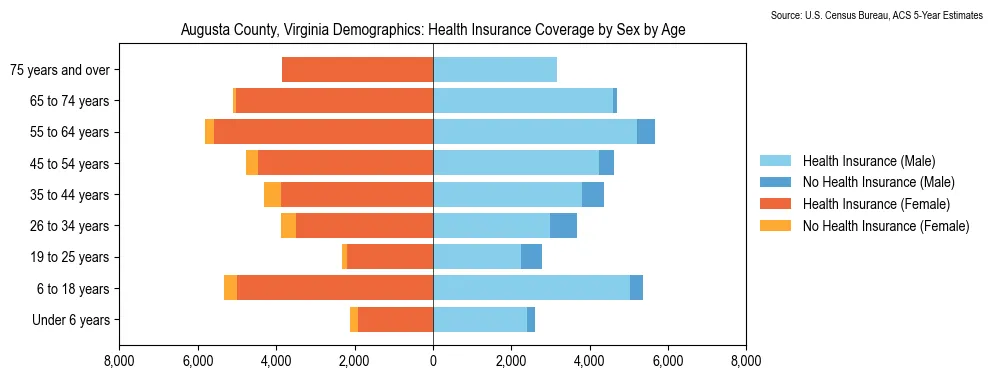
Augusta County, Virginia Demographics: Health Insurance Coverage Status by Sex by Age
In Augusta County, Virginia, 7.14% of the total population lacks health insurance coverage. Among children under 18, 7.44% of males and 8.88% of females are uninsured. For ages (18–34), the uninsured rate is 10.88% for males and 5.61% for females. Among ages 35–64, 12.67% of males and 8.61% of females are uninsured. Finally, for senior citizens (65+), 0.94% of males and 2.16% of females report no health insurance coverage. The chart below shows the distribution of health coverage status by sex by age for the population, based on the U.S. Census Bureau’s 2023 American Community Survey (ACS).
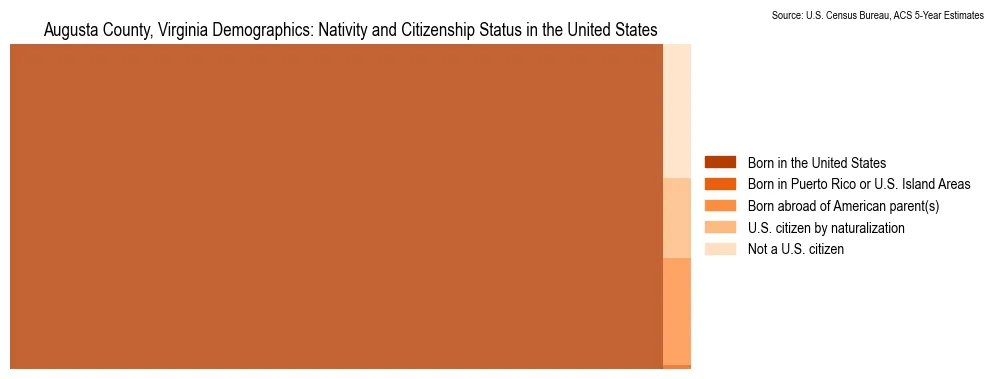
Augusta County, Virginia Demographics: Nativity and Citizenship Status in the United States
The chart shows the breakdown of the population of Augusta County, Virginia by nativity and citizenship status in the United States, based on the U.S. Census Bureau’s 2023 American Community Survey (ACS). 98.29% of the population of Augusta County, Virginia are United States citizens, including residents born in the United States, born in Puerto Rico or United States Island Areas, born abroad of American parent(s), or by naturalization. Of those, 1.02% became citizens through naturalization.
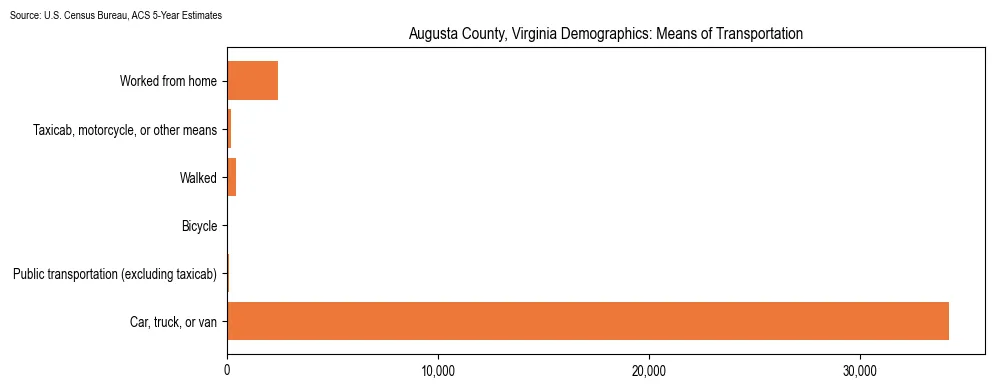
Augusta County, Virginia Demographics: Means of Transportation
The chart below shows how people in Augusta County, Virginia travel to work, based on the U.S. Census Bureau’s 2023 American Community Survey (ACS). The breakdown is as follows: Car, truck, or van: 91.61%; Public transportation (excluding taxicab): 0.24%; Bicycle: 0.00%; Walked: 1.17%; Taxicab, motorcycle, or other means: 0.50%; Worked from home: 6.48%.
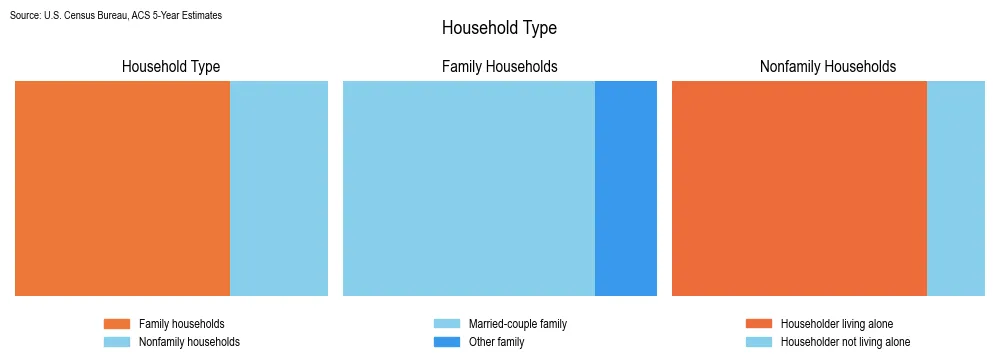
Augusta County, Virginia Demographics: Household Type
The chart below shows the breakdown of household types in Augusta County, Virginia, based on the U.S. Census Bureau’s 2023 American Community Survey (ACS). 68.46% are family households. Of these, 80.18% are married-couple families. Of the nonfamily households (31.54%), 81.55% represent householders living alone.